Msdb is a very important database as far as considering SQL Server, so called a biological clock & hippocampus.
Msdb database stores lots of information like agent jobs/ database backup-restore information and many more. We can quickly see a script developed to get job details and history information, mainly used msdb objects. To add to that, there is a script which pulls all information of back up and restore as well. In addition, some of Service Broker information, log shipping monitor history, SSIS packages, Database Engine Tuning Advisor data, Central Management Server (CMS) are also stored in msdb database.
Since it play vital role by saving all these information, it is highly recommended to take back up of msdb on a daily basis. Note that the msdb comes with simple recovery model by default, which can be changed to FULL as required depending on your requirement.
An important thing is maintenance of msdb database, since it stores all lots of information about your sql agent jobs and backup histories, a clear maintenance needs to be established for msdb like purging data more than 60 or 90 days etc. There are system procedures like sp_delete_backuphistory , sp_cleanup_log_shipping_history & sp_purge_jobhistory to cleanup the data from msdb.
Forbidden Actions
We cannot drop msdb database
We cannot set msdb database offline
We cannot enable Change Data Capture (CDC) or Change Tracking (CT) for msdb
Model database is another important system database in SQL Server. It is also called as “Template DB”; SQL Server uses this database as a template db to create a new database. We need this database for SQL Server to come online, because this database is being used to create TempDB while restarting the service/server.
At times, few developers will place objects (tables/procedures etc.) that needs to be created for every newly created database. This would avoid the work of creating those every time.
Recovery Model
Recovery model of “Model” database is depending on the SQL editions. The editions mostly suitable for test and development comes up with recovery model “SIMPLE” and higher editions with “FULL”. This is mainly because Production environment databases require a point in time recovery options on the verge of going corrupted.
It is also a good idea to have a full back up of model database in a daily basis considering there would not be any user transactional databases on Model database.
Model will act as a template only for new database creation, it does not have any impact on restore databases.
Its a short topic, but the importance of Model is high for SQL Server!
If you enjoyed this blog post, feel free to share it with your friends!
Let me start this blog post with a statement – “Master” database is the brain of SQL Server. We will go in detail why I would call it so.
If you ever worked in SQL Server, one way or other way you touched or used this system database. Master database is the primary configuration database in SQL Server. This system database is storing lots of information like configuration, login details, end points, linked server details, other object details etc. That means, In short – without master system database, the SQL Server will never be able to start its services.
Backing up of Master database is mastermind
Since Master database contains lots of important information as described above, it is very important to make sure we regularly backing up Master database. This would prevent to lose the important information at the time of corruption of this database. (We should also validate the backups as well.) Since master database would be generally small in size, backup process could be an instantaneous one.
Master database comes with simple recovery model, if you have a daily backup scheduled, there should not be a reason for change in recovery model. It is important to understand, not all objects can be scripted out from master databases, backup of mater database is unavoidable.
The most important aspect is that we can’t do transaction log backups for the master database, so there would be a chance of losing data that were made since the last full backup.
Forbidden operations to Master database
We cannot drop Master database
We cannot take Master database to offline
We cannot rename Master database
We cannot change the owner of Master database
We cannot set Change Data Capture (CDC) on Master database
Power BI is a dashboard reporting tool, also an user friendly tool which can get inputs from various data sources (SQL Server, excel, csv, analysis services and text files) and generate a graphical and meaningful dashboards. In general
Report – is a single visual representation
Dashboard – is a two or more reports/visuals together in same page
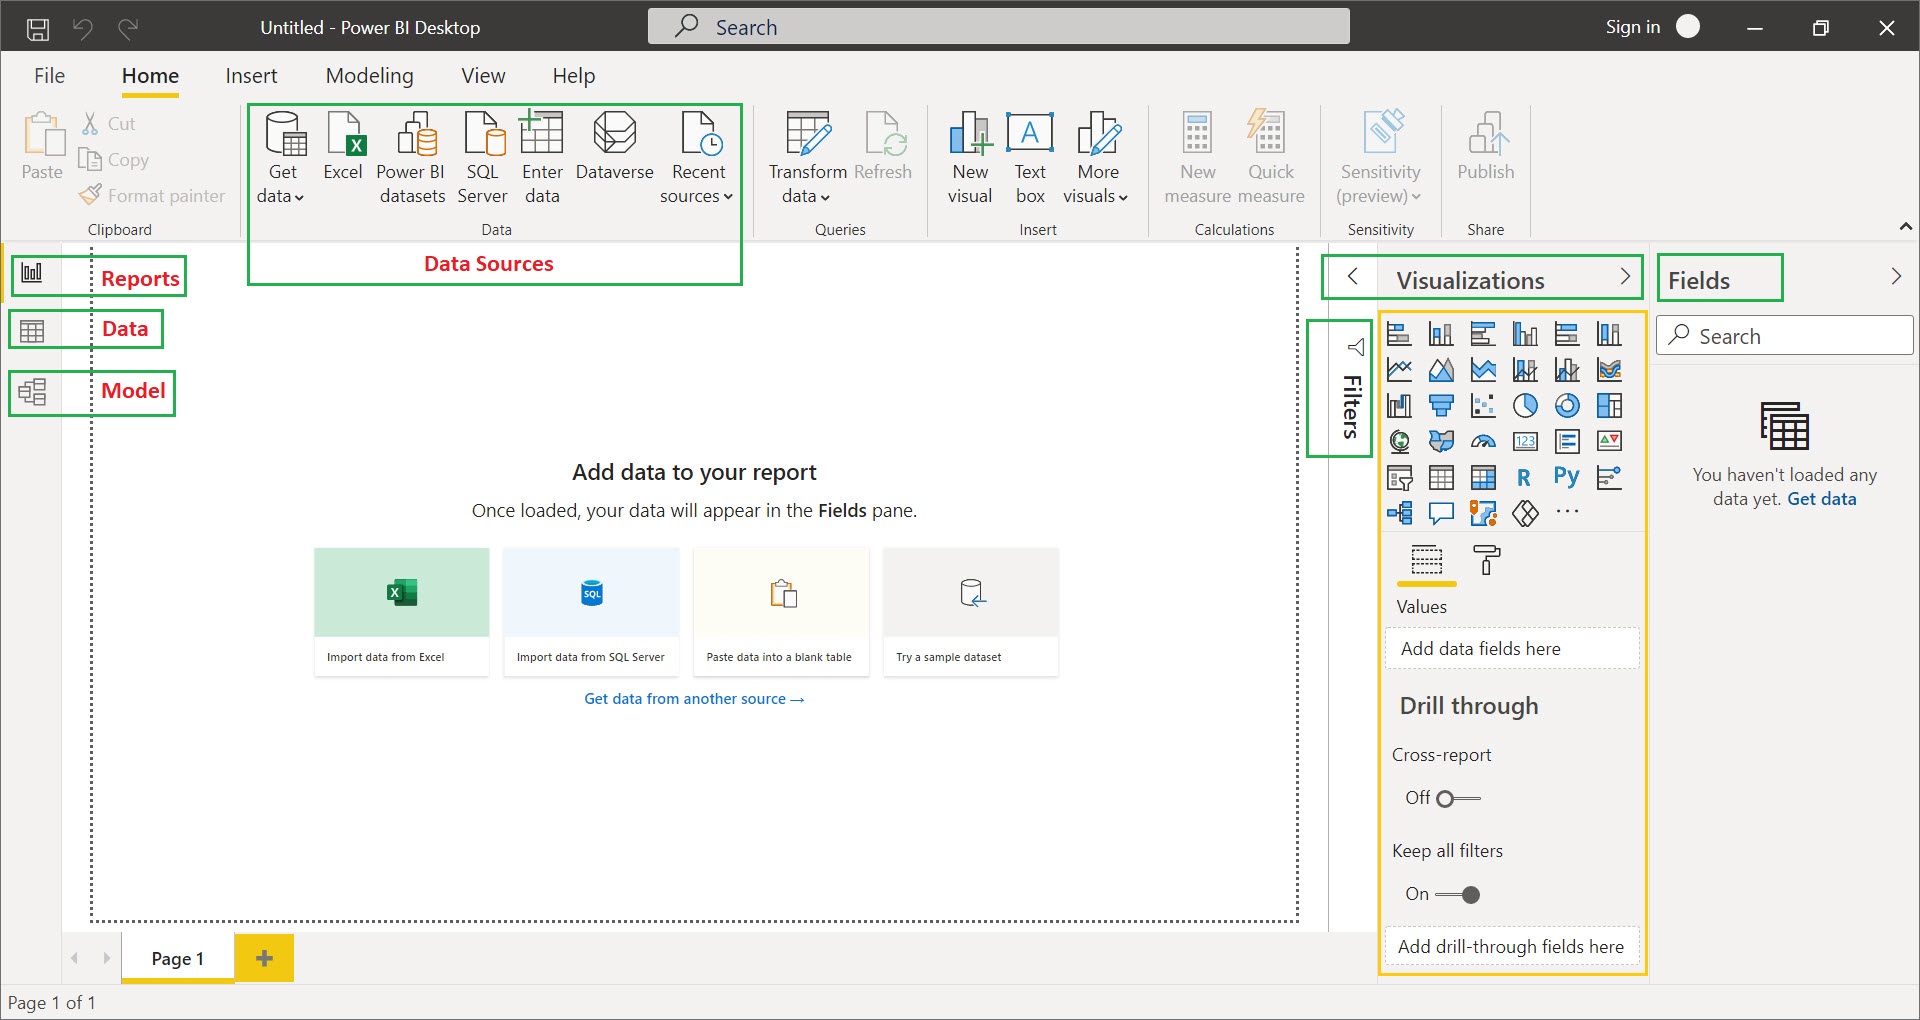
Power BI Desktop has 3 tabs mainly Reports, Data and Model (as shown below)
i) Model – is a data source view diagram to view all imported tables objects from any one of the input data sources
ii) Data – place where you can preview the sample data of the imported table objects
iii) Reports – for creating dashboards/reports from the model table objects
Following are the other tabs which are used to support the Model, Data and Reports tab
Data Sources – used to get the Input data for Dashboards/Reports
Visualization – used to show the data in more readable and understandable formats
Fields – contains the table objects along with Measures (names) and Values (sales, score)
Filters – used to filter data on page level or visual level
Below is the sample SQL data consists of 3 tables which has employee’s Mathsmark, Interest and Sales data. Execute this script in your SQL Server Management Studio before start creating Power BI dashboard, it acts as a Data input for Power BI Dashboard.
Create Database Power_BI
GO

---Employee's Mathsmark---
drop table if exists Mathsmark
create table Mathsmark(
	EmpName Nvarchar(1000),
	Score Int
)
Insert into Mathsmark (EmpName,Score)
values ('John',50),('Mac',35),('Lion',70),('Tiger',62),('Pigeon',23),('Alex',92),('Jack',84)

---Employee's Interest---
drop table if exists Interest
create table Interest(
	EmpName Nvarchar(1000),
	Games Nvarchar(1000)
)
Insert into Interest (EmpName,Games)
values ('John','Cricket'),('Mac','Football'),('Lion','Hockey'),('Tiger','Football'),('Pigeon','Cricket'),('Alex','Chess'),('Jack','Football')

---Employee's Sales---
drop table if exists Sales
create table Sales(
	EmpName Nvarchar(1000),
	SalesNo Int
)
Insert into Sales (EmpName, SalesNo)
values ('John',550),('Mac',305),('Lion',730),('Tig
er',610),('Pigeon',260),('Alex',950),('Jack',870)
In this blog, we will see how to create Power BI dashboard with Line Chart, Pie Chart, Stacked Column Chart, Matrix, Table and Donut Chart, Let’s see step by step procedure for creating the Dashboard.
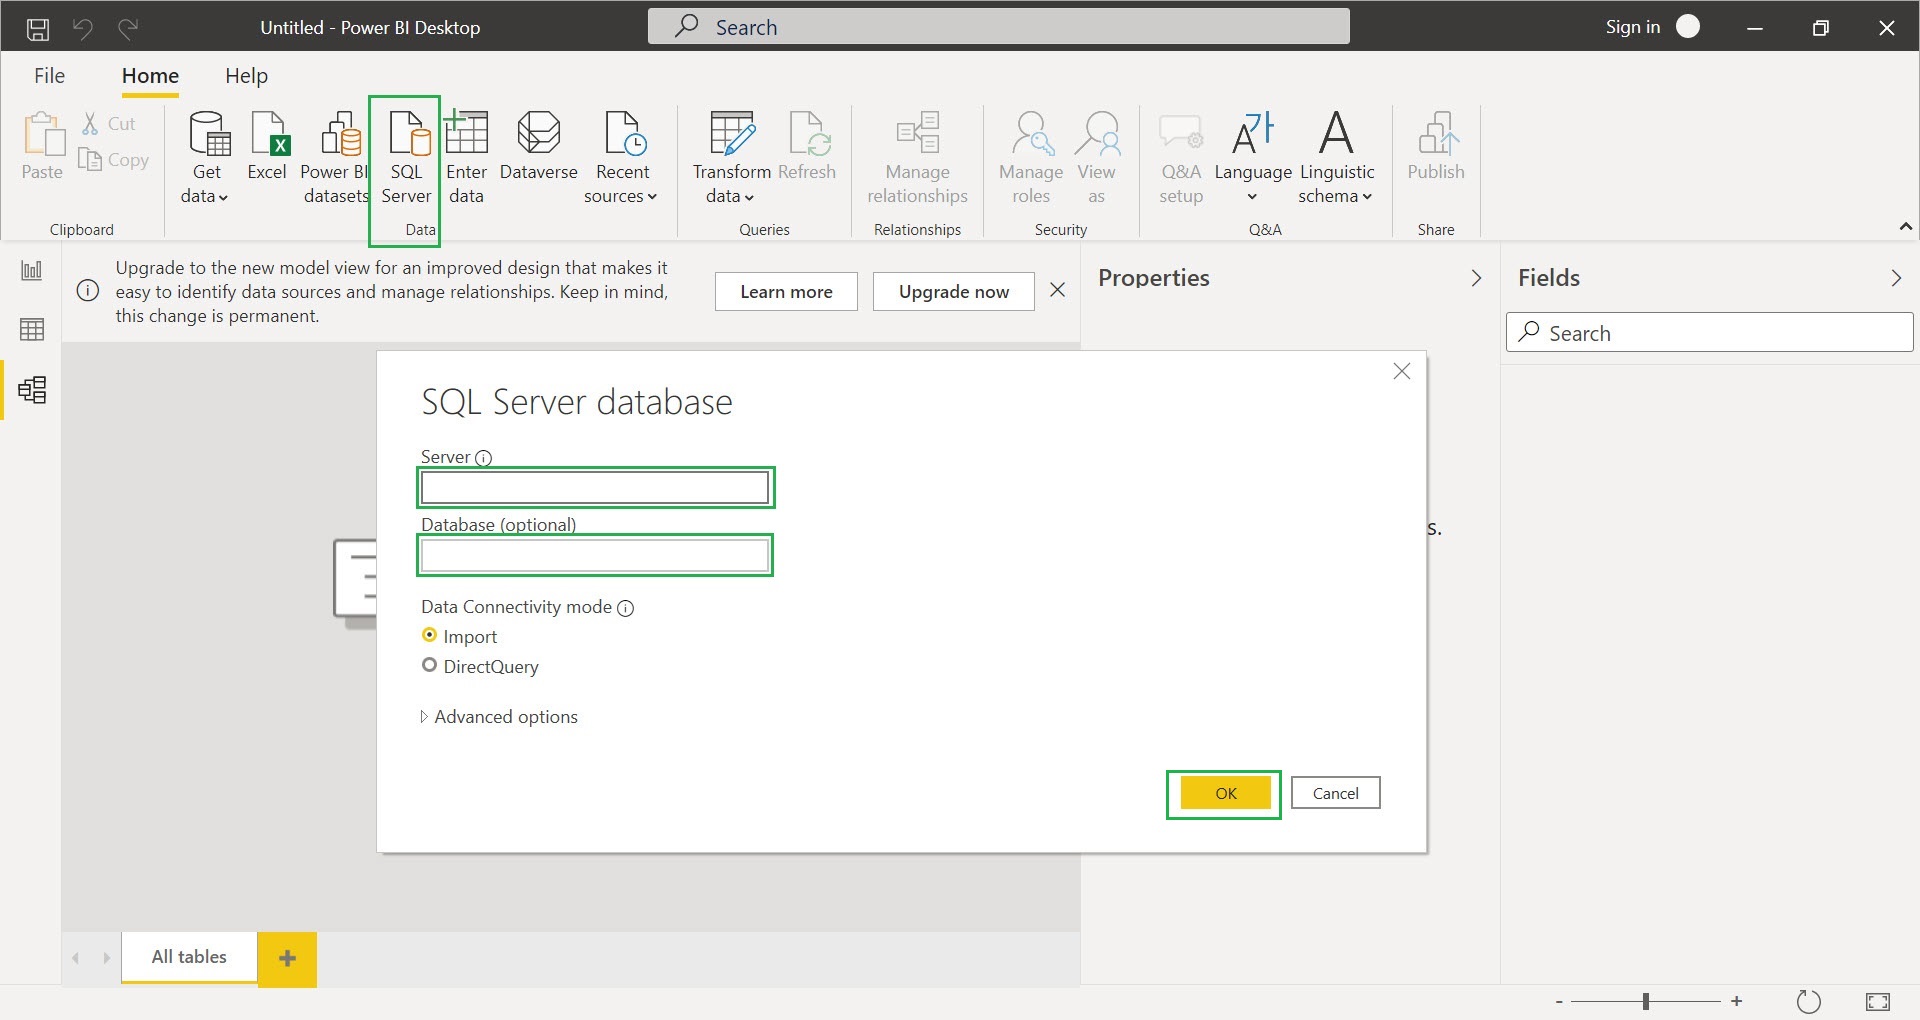
Step 1:- Importing of SQL Data to Power BI Desktop, select “SQL Server” from “Data” tab and give your Servername and Database as “Power_BI” and click “OK”
Step 2:- Check all 3 table check boxes and click “Load”, you can also view the preview data by selecting the table object
After clicking the “Load” button, you can view the data model of “Power_BI” database in the “Model” tab, objects relationship are created automatically by the Power BI tool, all the table objects fields in displayed in right side “Fields” tab
You can also view table’s preview data and objects names, fields in “Data” tab
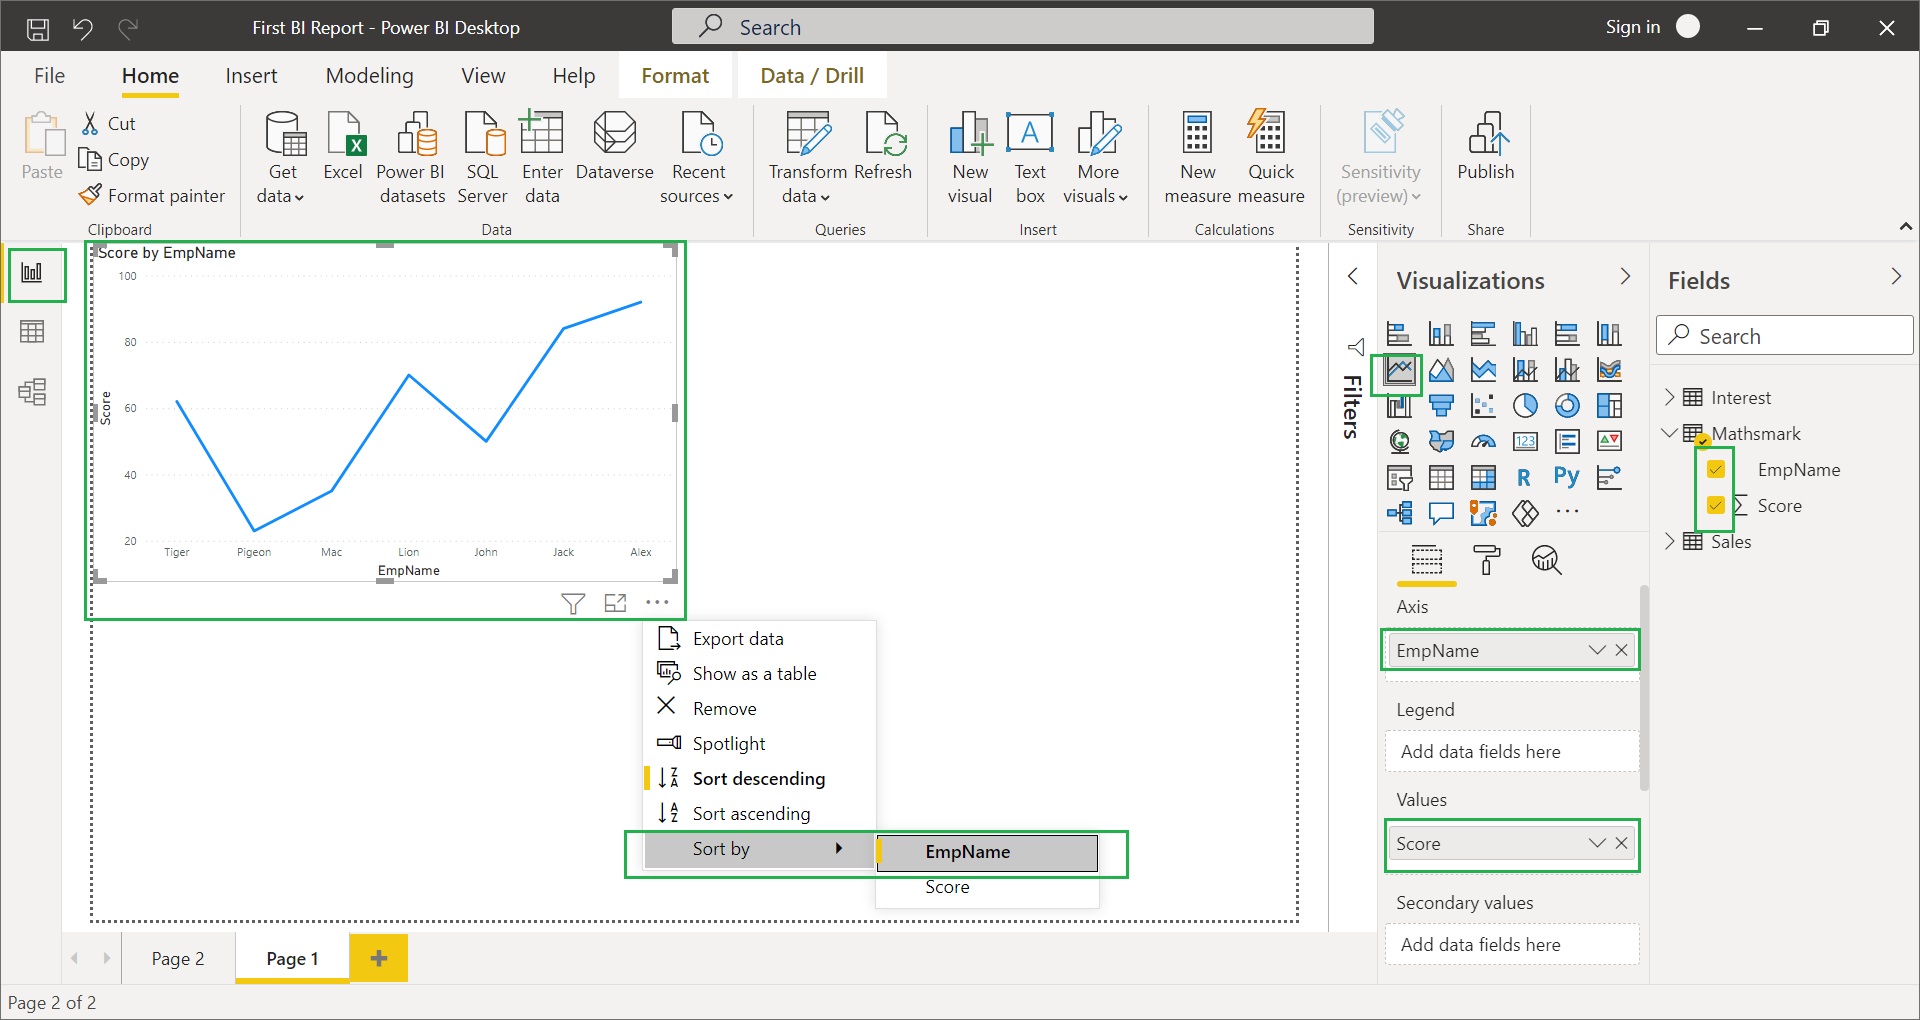
Step 3:- Select “Line Chart” in Visualizations tab and check the fields in “Mathsmark” table and also sort the line chart by “EmpName” field
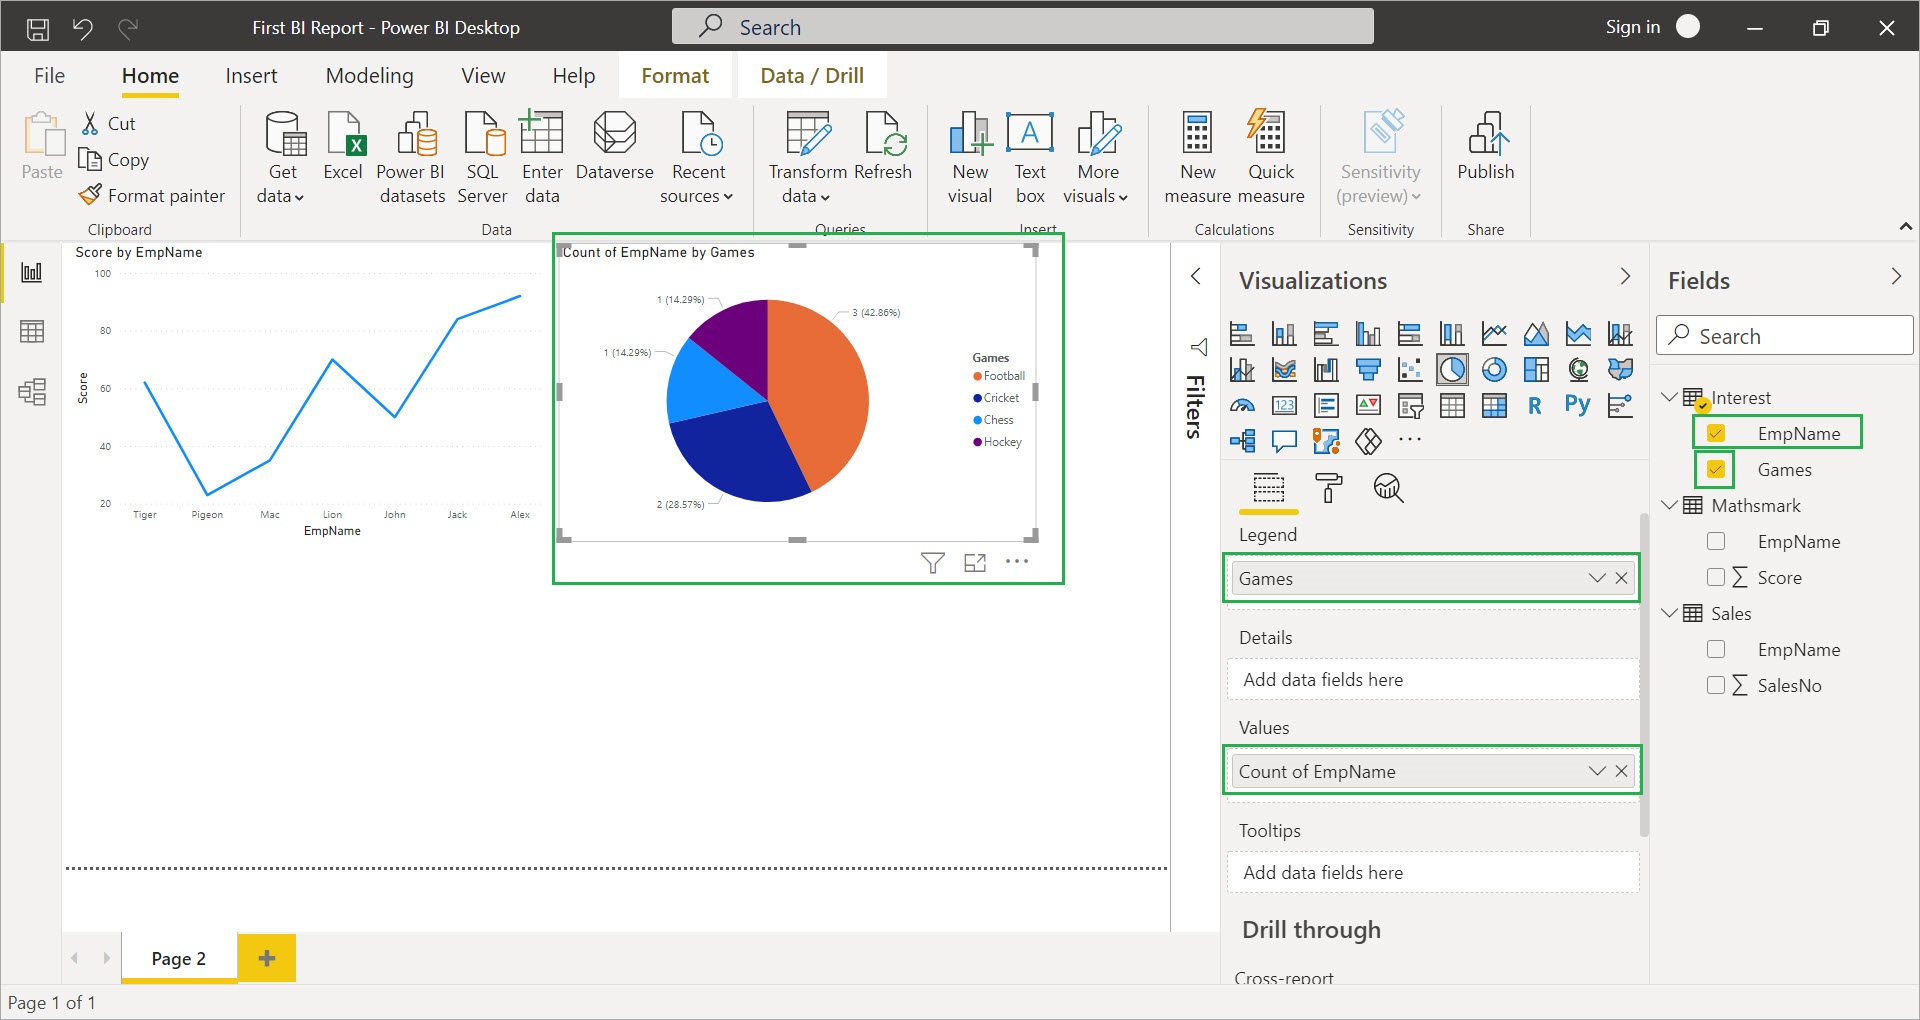
Step 4:- Select “Pie Chart” in Visualizations tab and check the “Games” fields in “Interest” table and drag “EmpName” field to values tab, it will display the no. of employees interested in which games
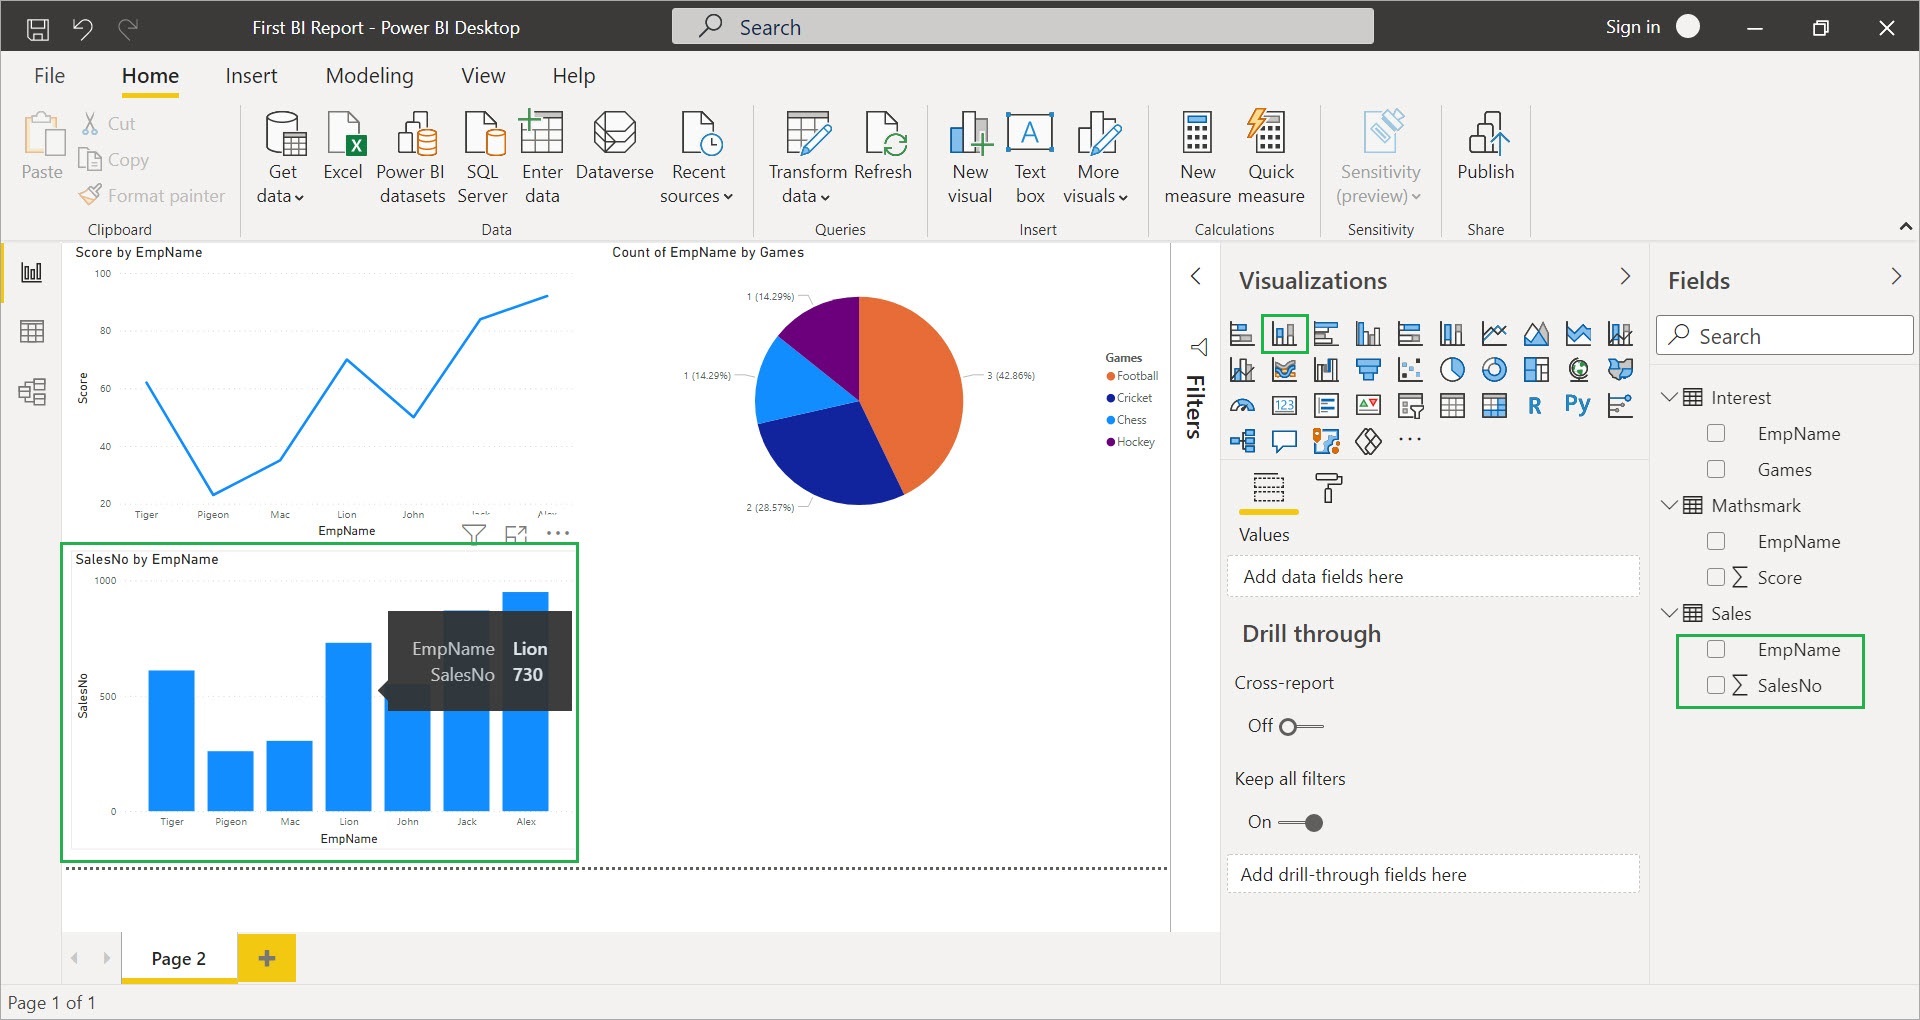
Step 5:- select “Stacked Column Chart” in Visualizations tab and check “Sales” table fields, as mentioned in above here I’ve sorted the data by “EmpName” Field
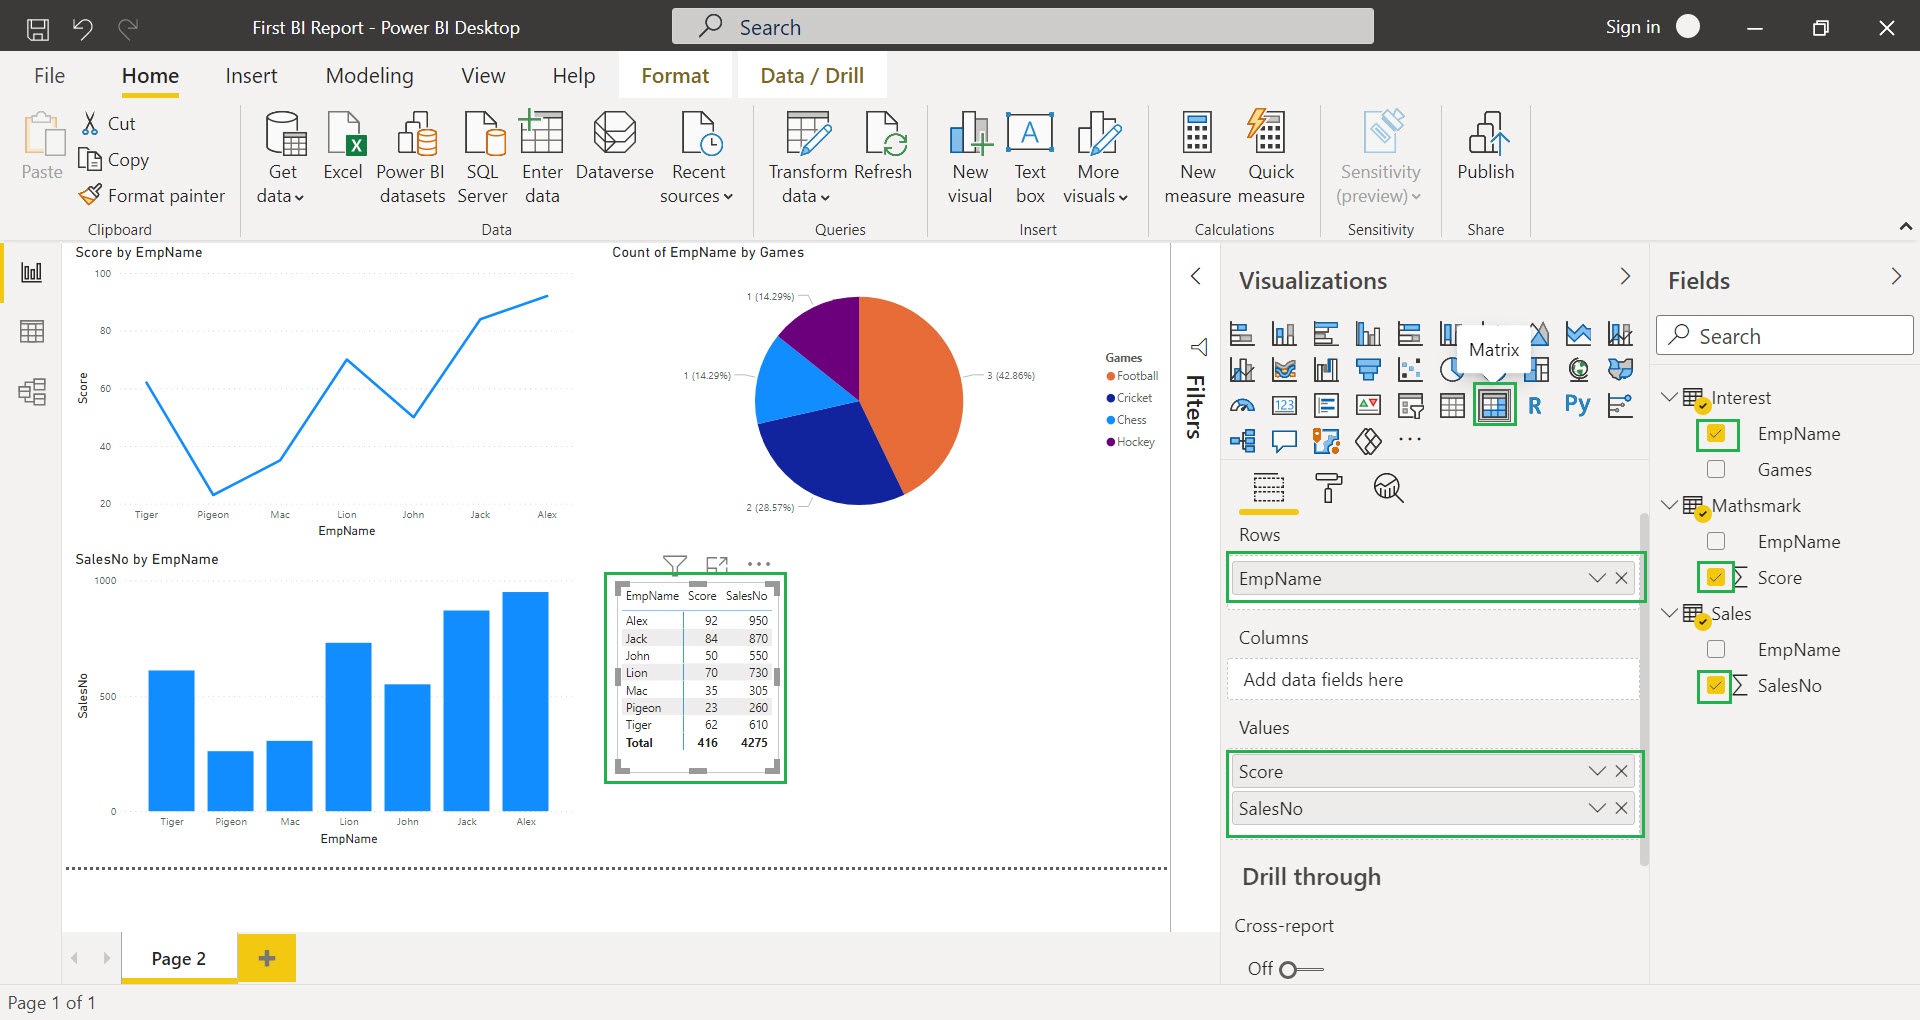
Step 6:- select “Matrix” in Visualizations tab and check the fields (EmpName, Score and SalesNo)
Step 7:- select “Table” in Visualizations tab and check the fields (EmpName and Games) from “Interest” table
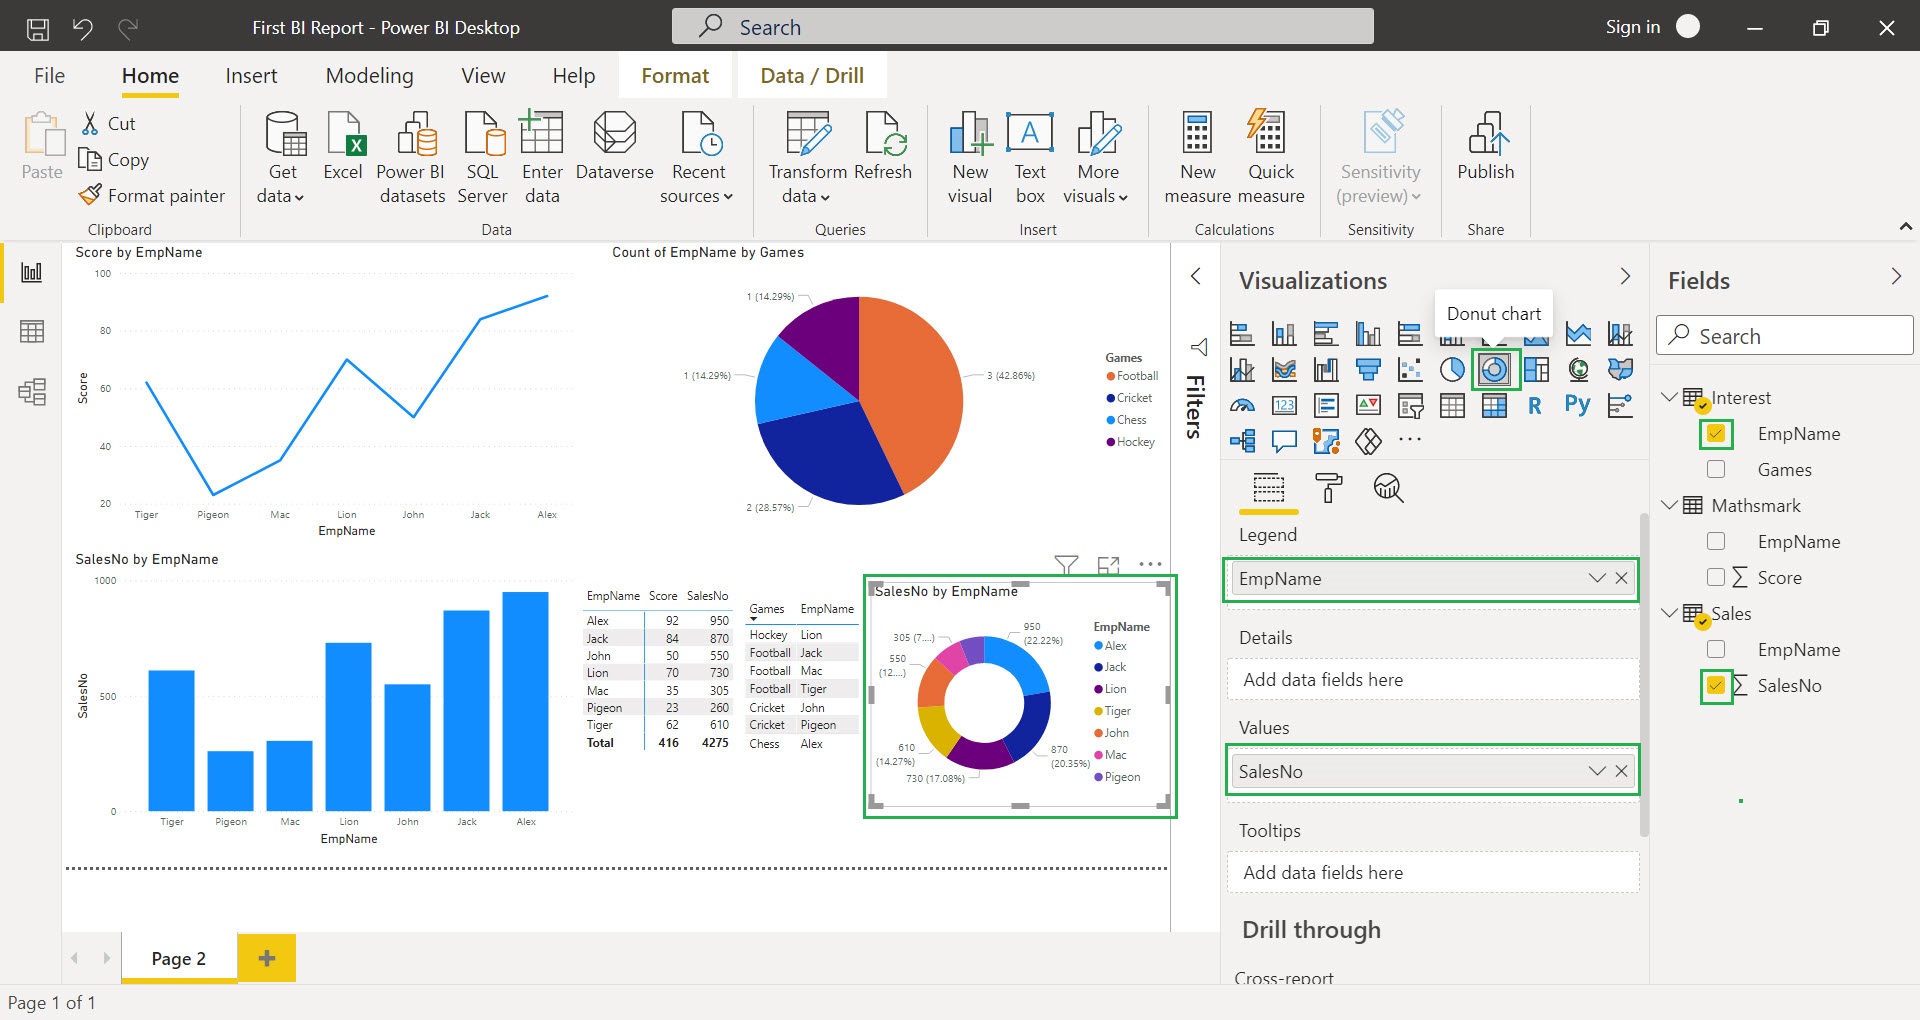
Step 8:- select “Donut Chart” in Visualizations tab and check the “EmpName” field from “Interest” table and “SalesNo” field from “Sales” table
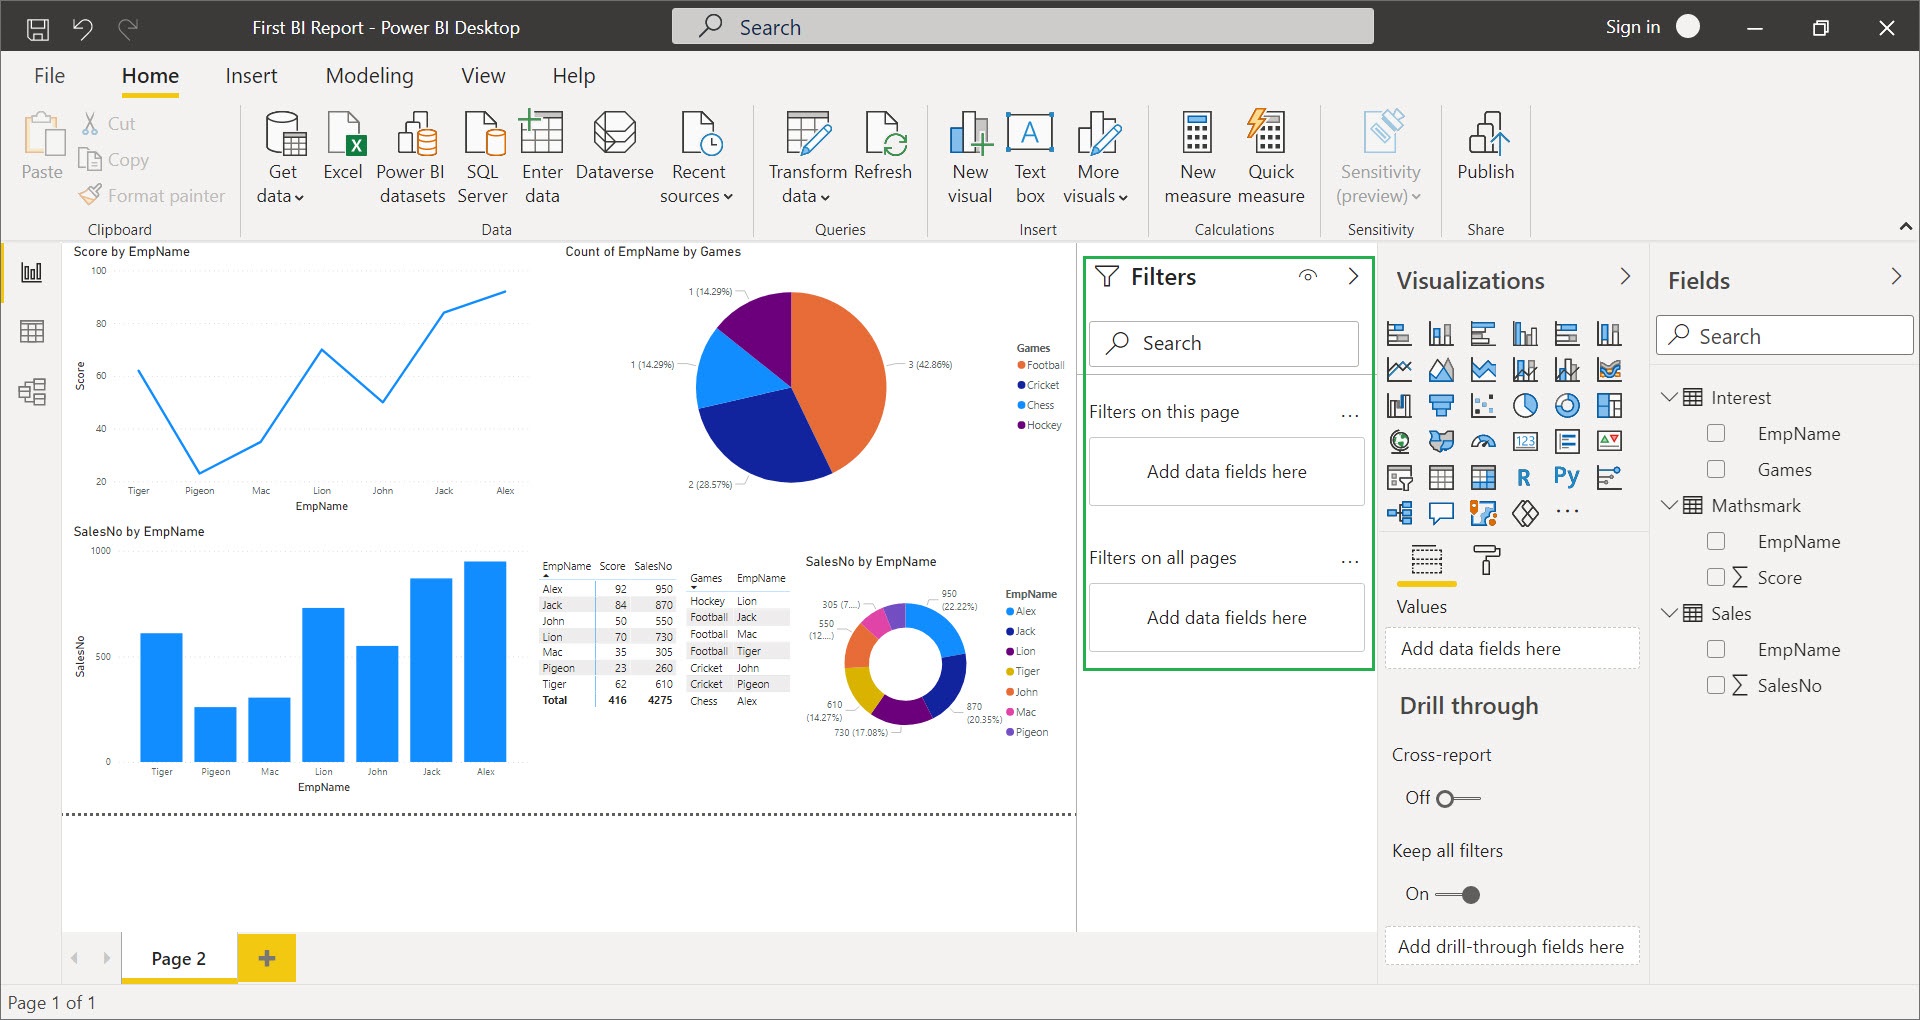
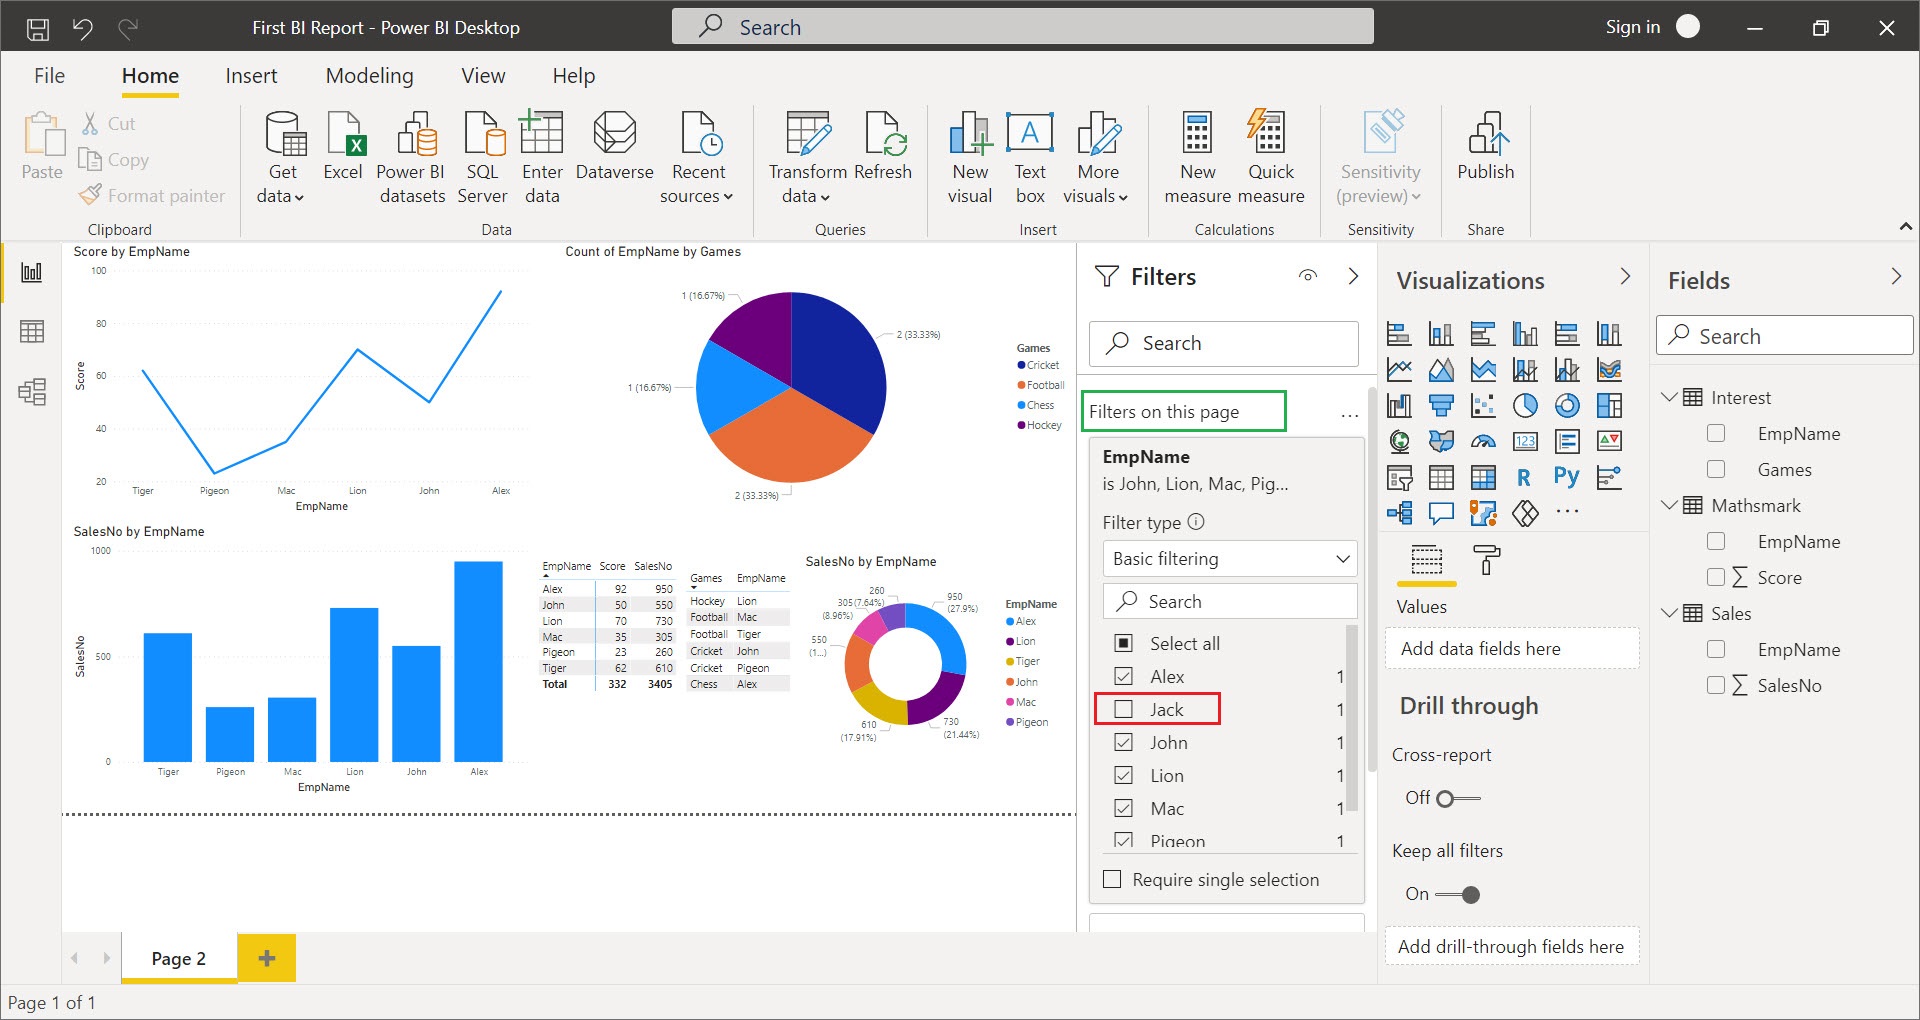
Now we will see how to filter data in dashboards/reports, in Power BI we have 3 level of filtering (Report/Visual, Page and All Page), please note that the report/visual level filter will appear only after selecting page level filter.
here we have used the page level filter in which (EmpName =”Jack”) is excluded, now the dashboard is showing all Employee’s data expect “Jack”
Happy Learning !! Please share it with your friends If you like this post.
Power BI is a dashboard reporting tool which uses the various data sources (SQL Server, excel, csv, analysis services and text files) as input for reports/dashboards.
Benefits of Power BI:-
Dashboard Reporting
Easy and User Friendly
Minimal Coding and no technical expertise is required
Can use wide variety of data source
Cloud Reporting (so you can access reports in mobiles)
You can download the Power BI Desktop setup file (PBIDesktopSetup_x64.exe) from any one of the below links,