Overview:-
Power BI is a dashboard reporting tool, also an user friendly tool which can get inputs from various data sources (SQL Server, excel, csv, analysis services and text files) and generate a graphical and meaningful dashboards. In general
Report – is a single visual representation
Dashboard – is a two or more reports/visuals together in same page
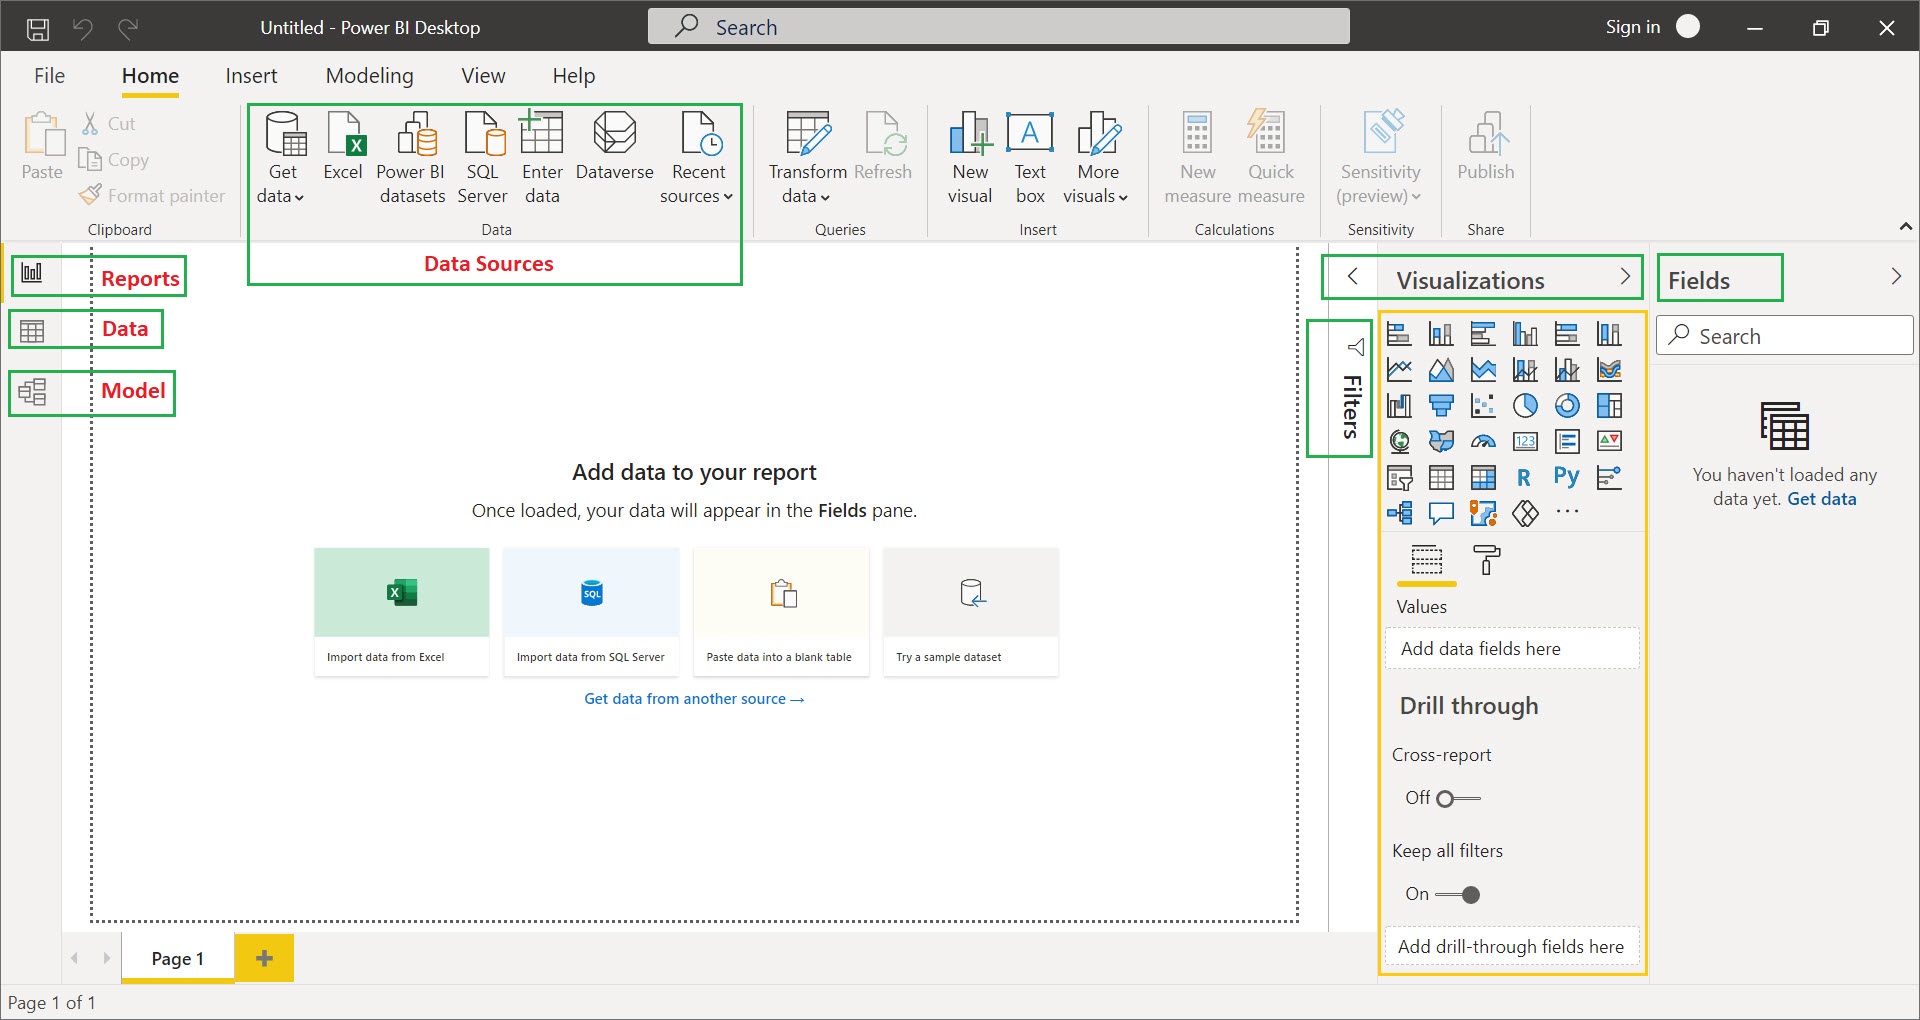
Power BI Desktop has 3 tabs mainly Reports, Data and Model (as shown below)
i) Model – is a data source view diagram to view all imported tables objects from any one of the input data sources
ii) Data – place where you can preview the sample data of the imported table objects
iii) Reports – for creating dashboards/reports from the model table objects
Following are the other tabs which are used to support the Model, Data and Reports tab
- Data Sources – used to get the Input data for Dashboards/Reports
- Visualization – used to show the data in more readable and understandable formats
- Fields – contains the table objects along with Measures (names) and Values (sales, score)
- Filters – used to filter data on page level or visual level
Below is the sample SQL data consists of 3 tables which has employee’s Mathsmark, Interest and Sales data. Execute this script in your SQL Server Management Studio before start creating Power BI dashboard, it acts as a Data input for Power BI Dashboard.
Create Database Power_BI
GO

---Employee's Mathsmark---
drop table if exists Mathsmark
create table Mathsmark(
	EmpName Nvarchar(1000),
	Score Int
)
Insert into Mathsmark (EmpName,Score)
values ('John',50),('Mac',35),('Lion',70),('Tiger',62),('Pigeon',23),('Alex',92),('Jack',84)

---Employee's Interest---
drop table if exists Interest
create table Interest(
	EmpName Nvarchar(1000),
	Games Nvarchar(1000)
)
Insert into Interest (EmpName,Games)
values ('John','Cricket'),('Mac','Football'),('Lion','Hockey'),('Tiger','Football'),('Pigeon','Cricket'),('Alex','Chess'),('Jack','Football')

---Employee's Sales---
drop table if exists Sales
create table Sales(
	EmpName Nvarchar(1000),
	SalesNo Int
)
Insert into Sales (EmpName, SalesNo)
values ('John',550),('Mac',305),('Lion',730),('Tig
er',610),('Pigeon',260),('Alex',950),('Jack',870)
In this blog, we will see how to create Power BI dashboard with Line Chart, Pie Chart, Stacked Column Chart, Matrix, Table and Donut Chart, Let’s see step by step procedure for creating the Dashboard.
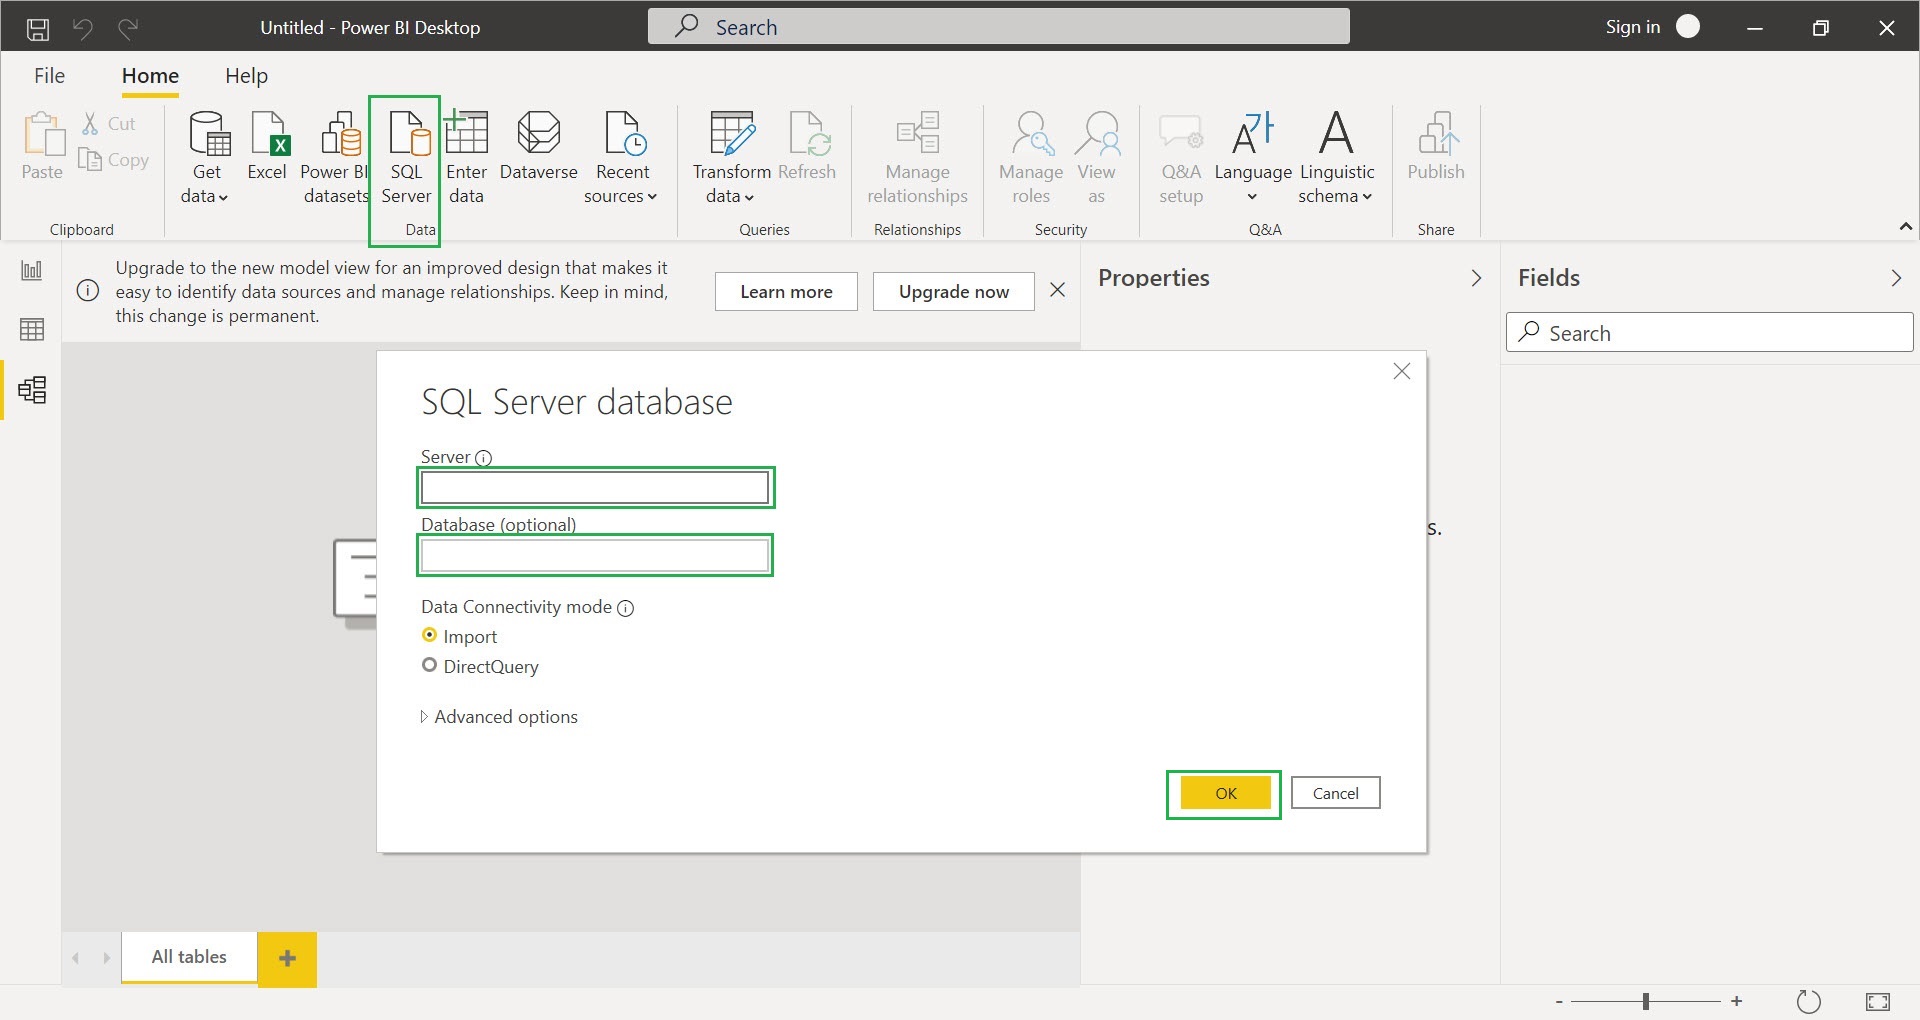
Step 1:- Importing of SQL Data to Power BI Desktop, select “SQL Server” from “Data” tab and give your Servername and Database as “Power_BI” and click “OK”
Step 2:- Check all 3 table check boxes and click “Load”, you can also view the preview data by selecting the table object

After clicking the “Load” button, you can view the data model of “Power_BI” database in the “Model” tab, objects relationship are created automatically by the Power BI tool, all the table objects fields in displayed in right side “Fields” tab

You can also view table’s preview data and objects names, fields in “Data” tab

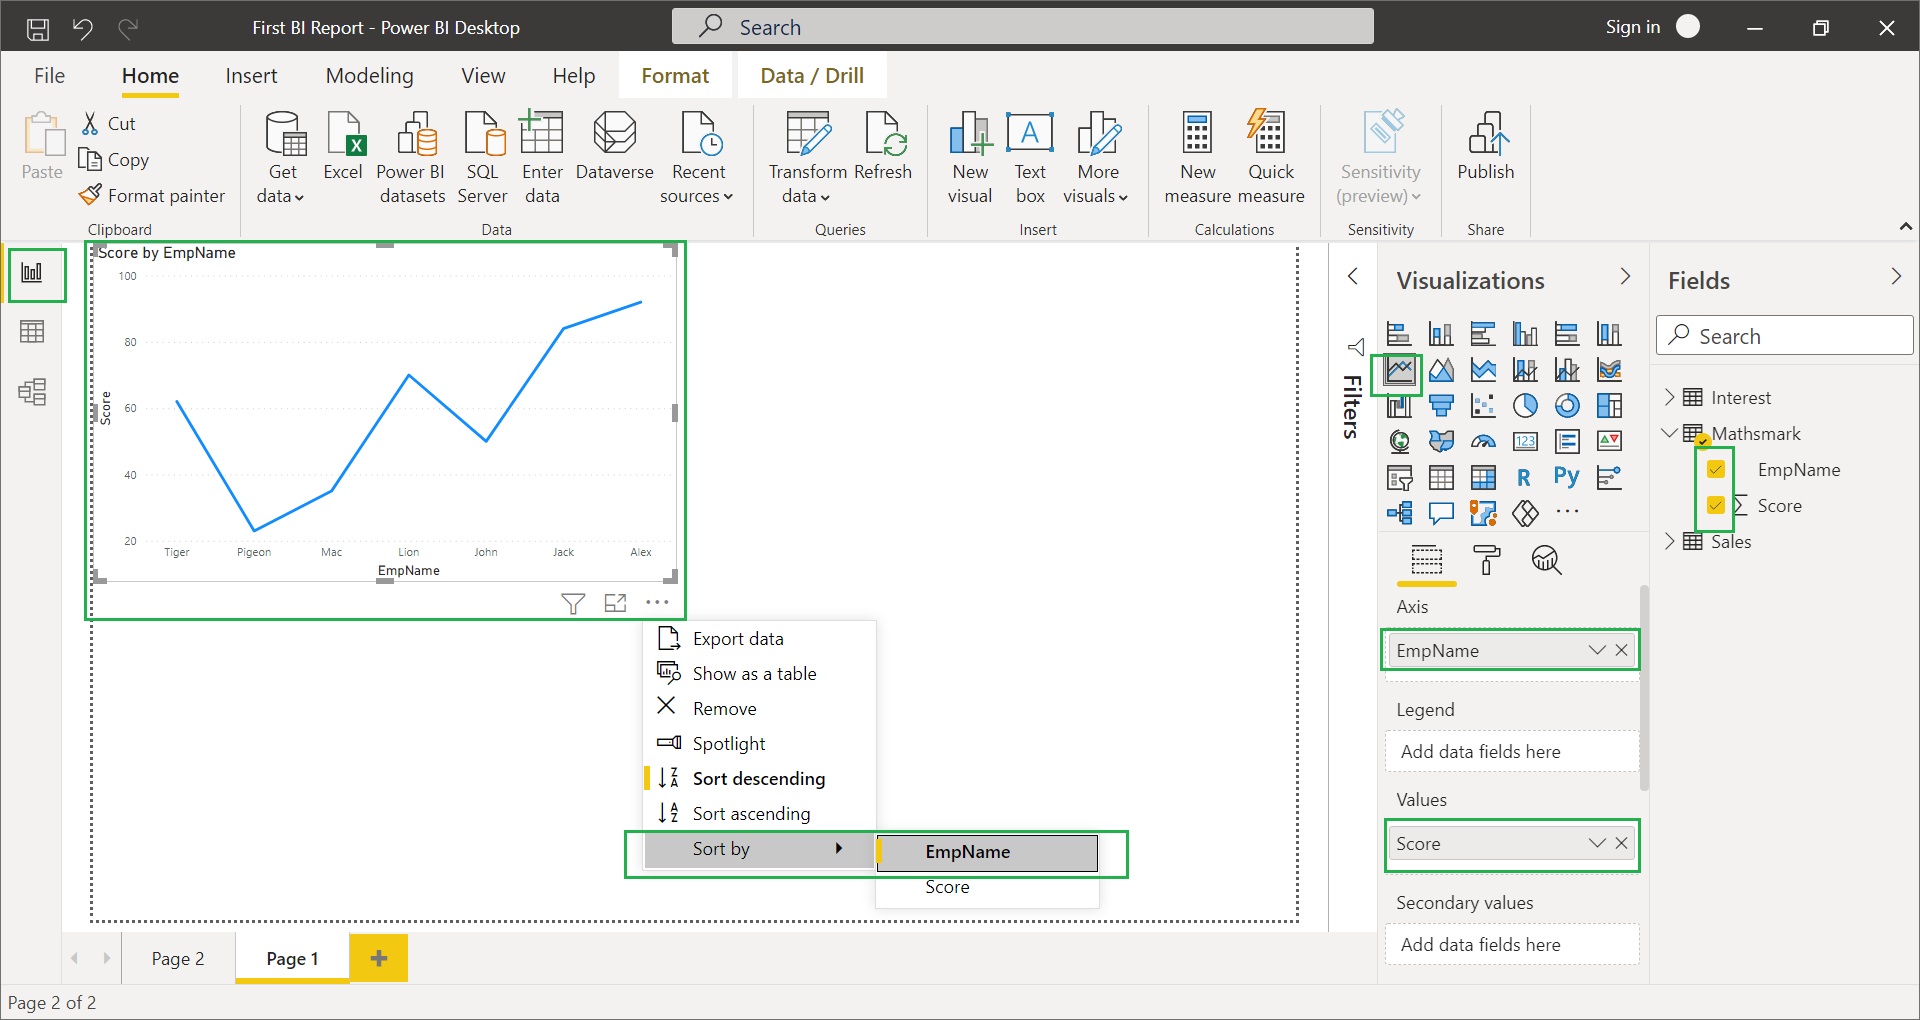
Step 3:- Select “Line Chart” in Visualizations tab and check the fields in “Mathsmark” table and also sort the line chart by “EmpName” field
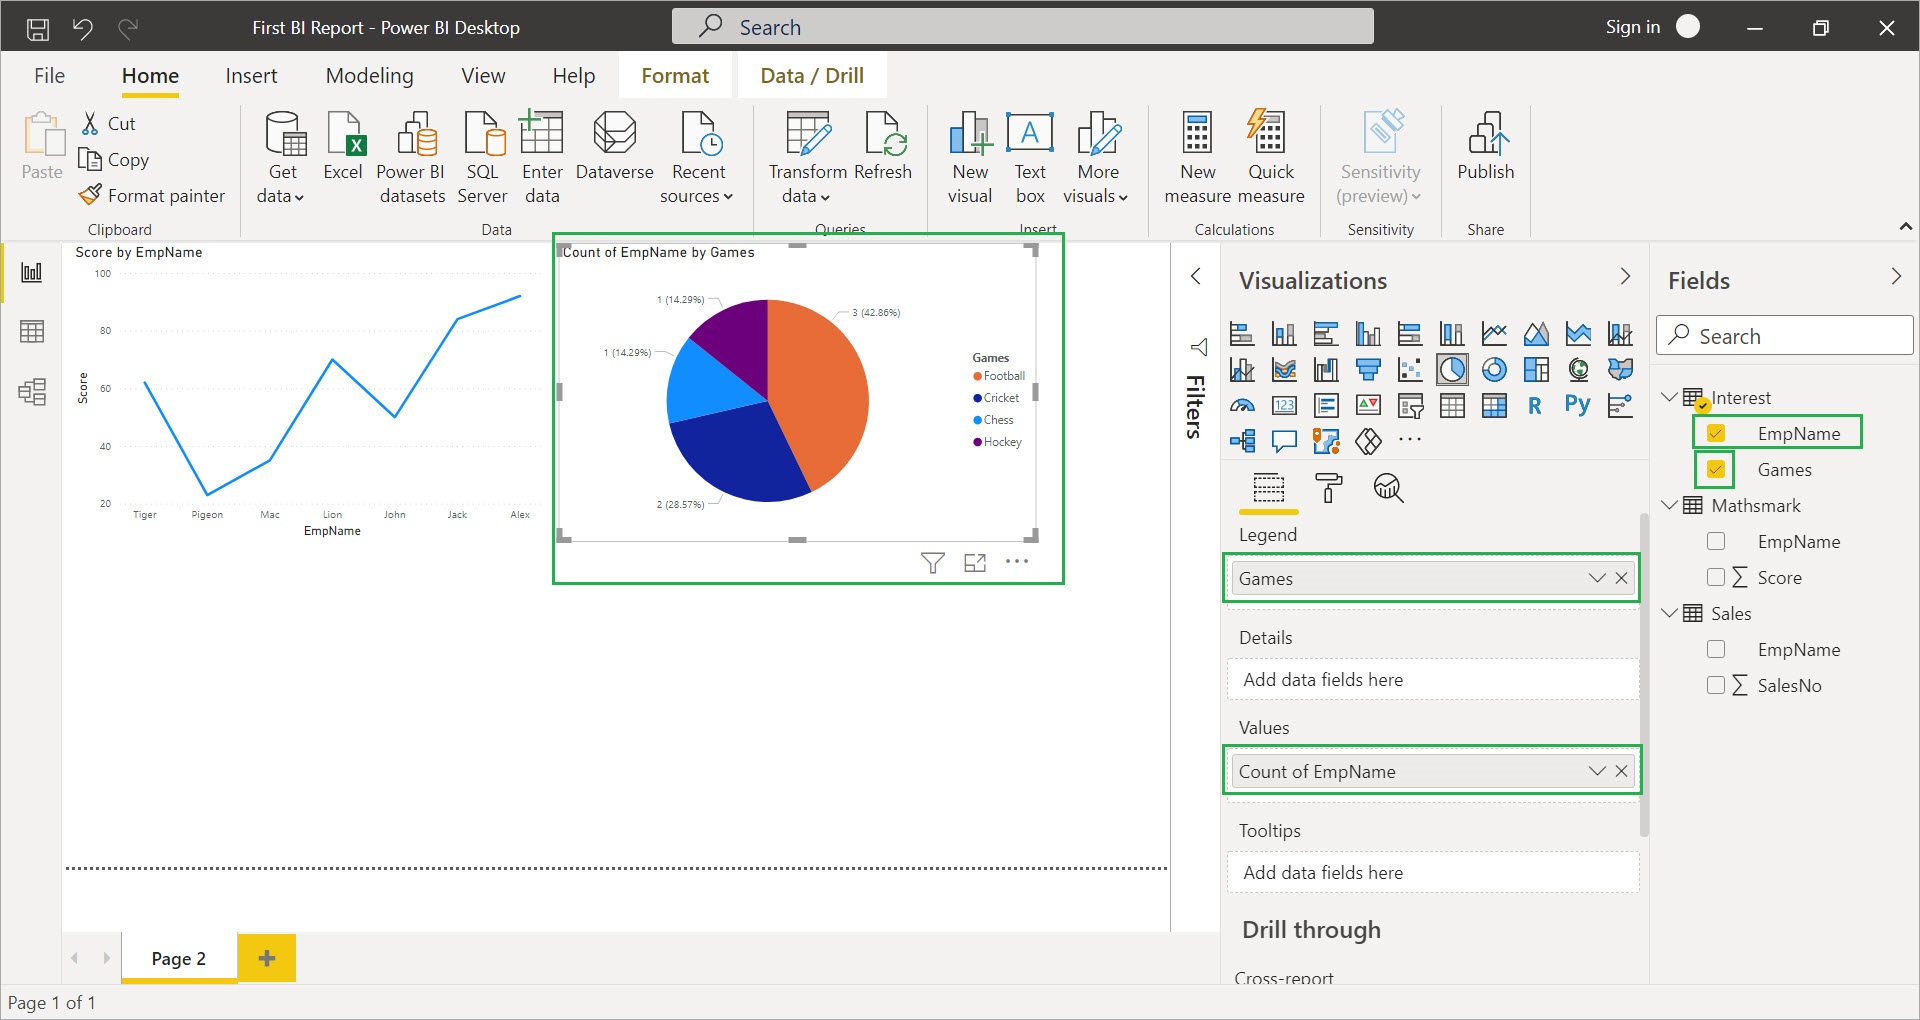
Step 4:- Select “Pie Chart” in Visualizations tab and check the “Games” fields in “Interest” table and drag “EmpName” field to values tab, it will display the no. of employees interested in which games
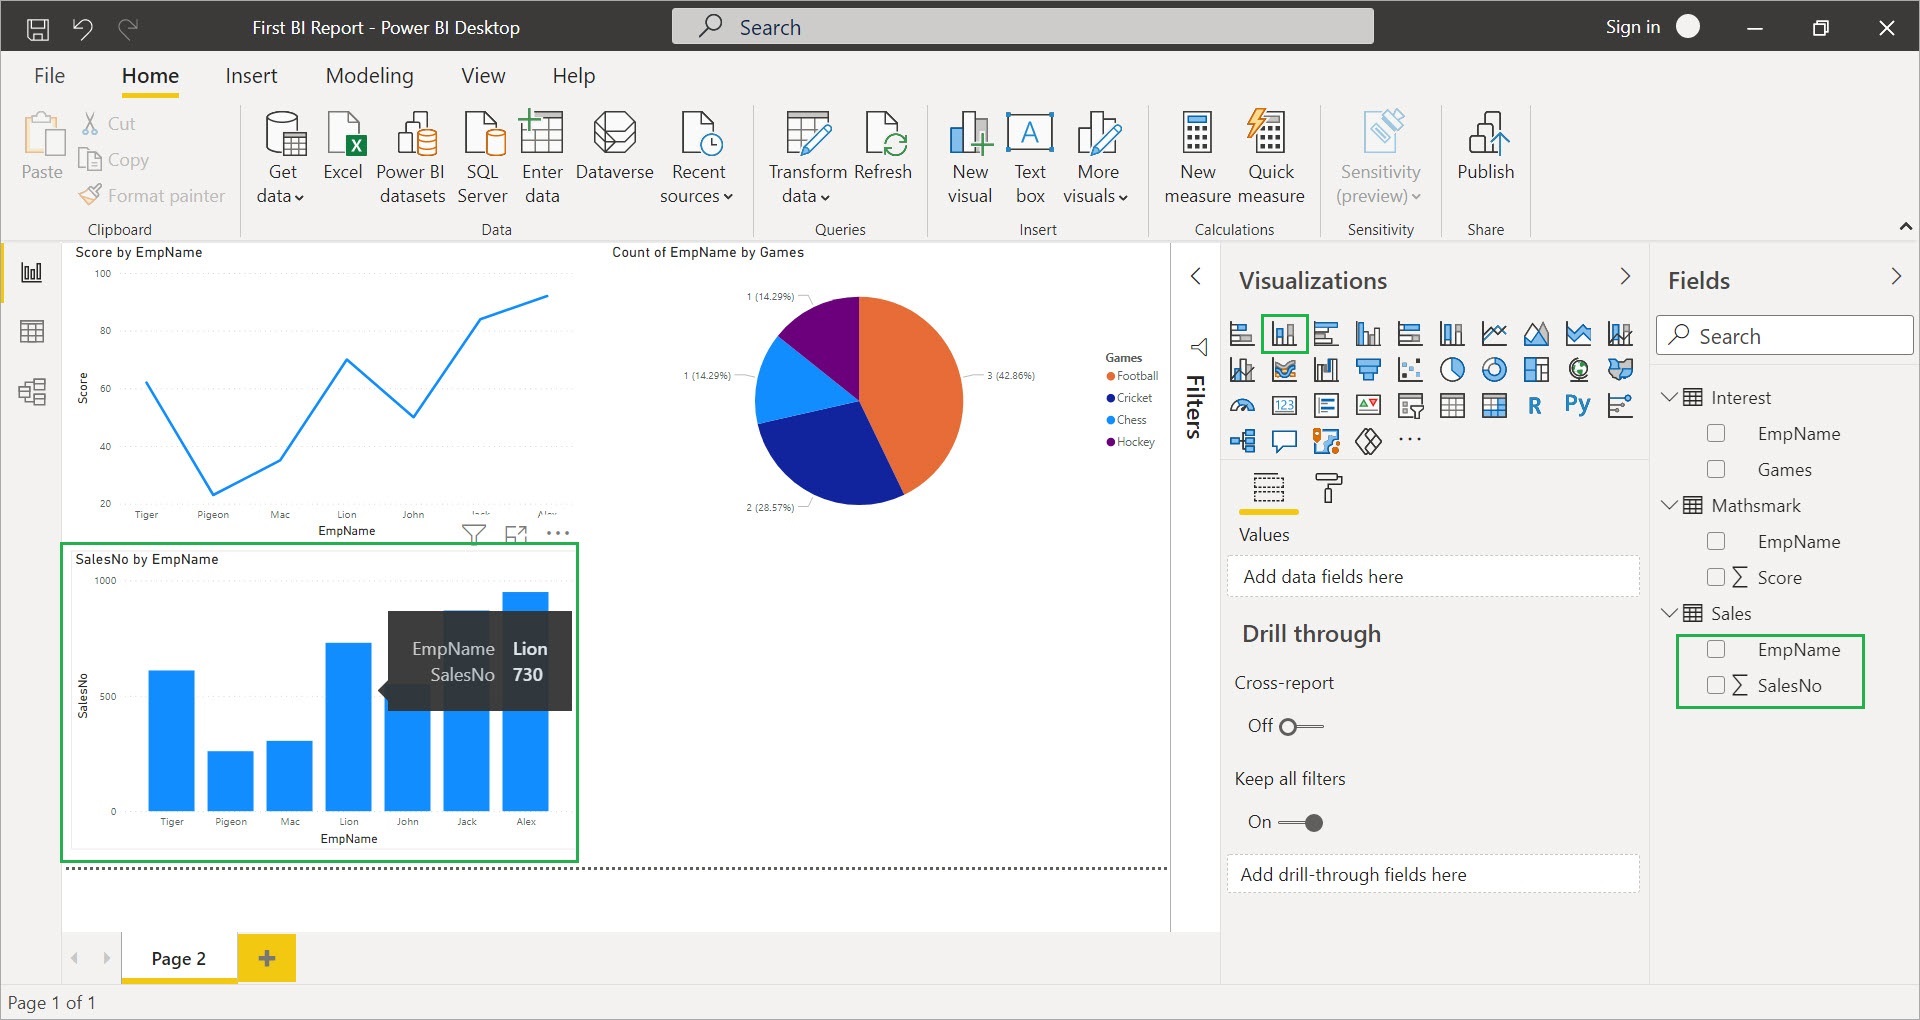
Step 5:- select “Stacked Column Chart” in Visualizations tab and check “Sales” table fields, as mentioned in above here I’ve sorted the data by “EmpName” Field
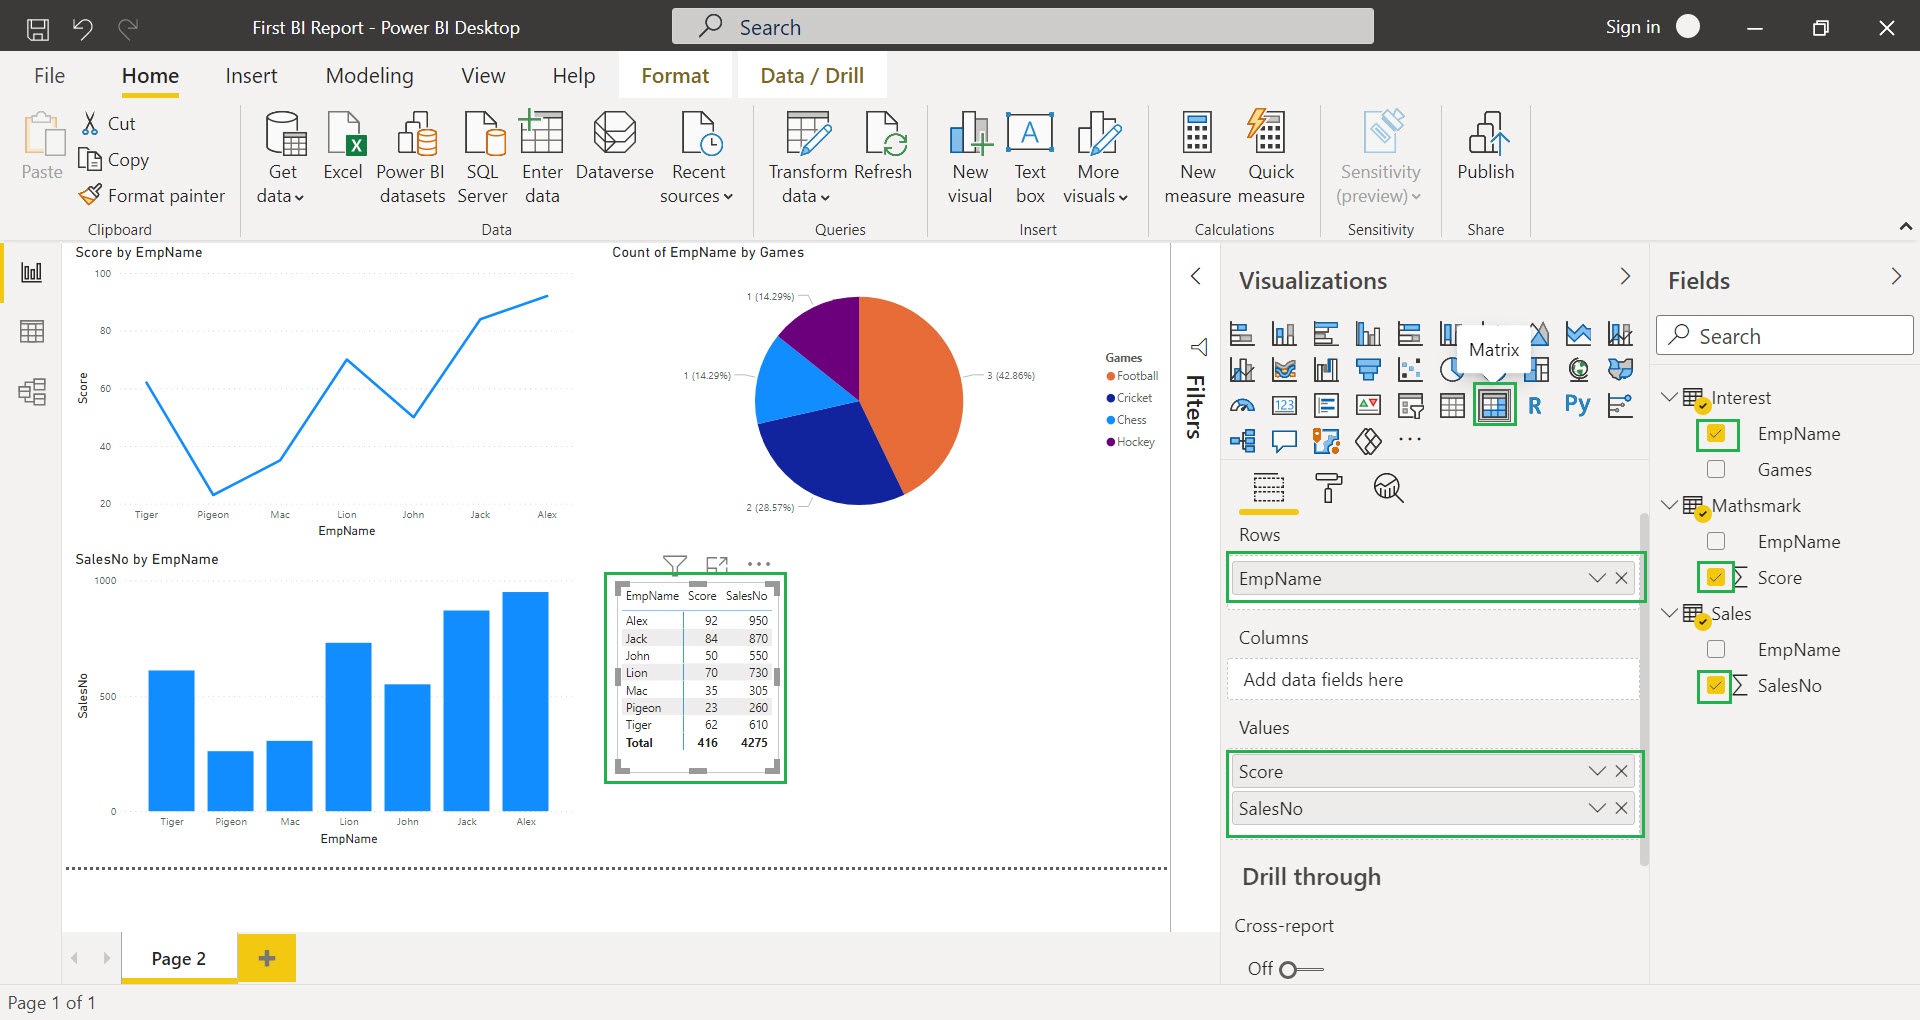
Step 6:- select “Matrix” in Visualizations tab and check the fields (EmpName, Score and SalesNo)
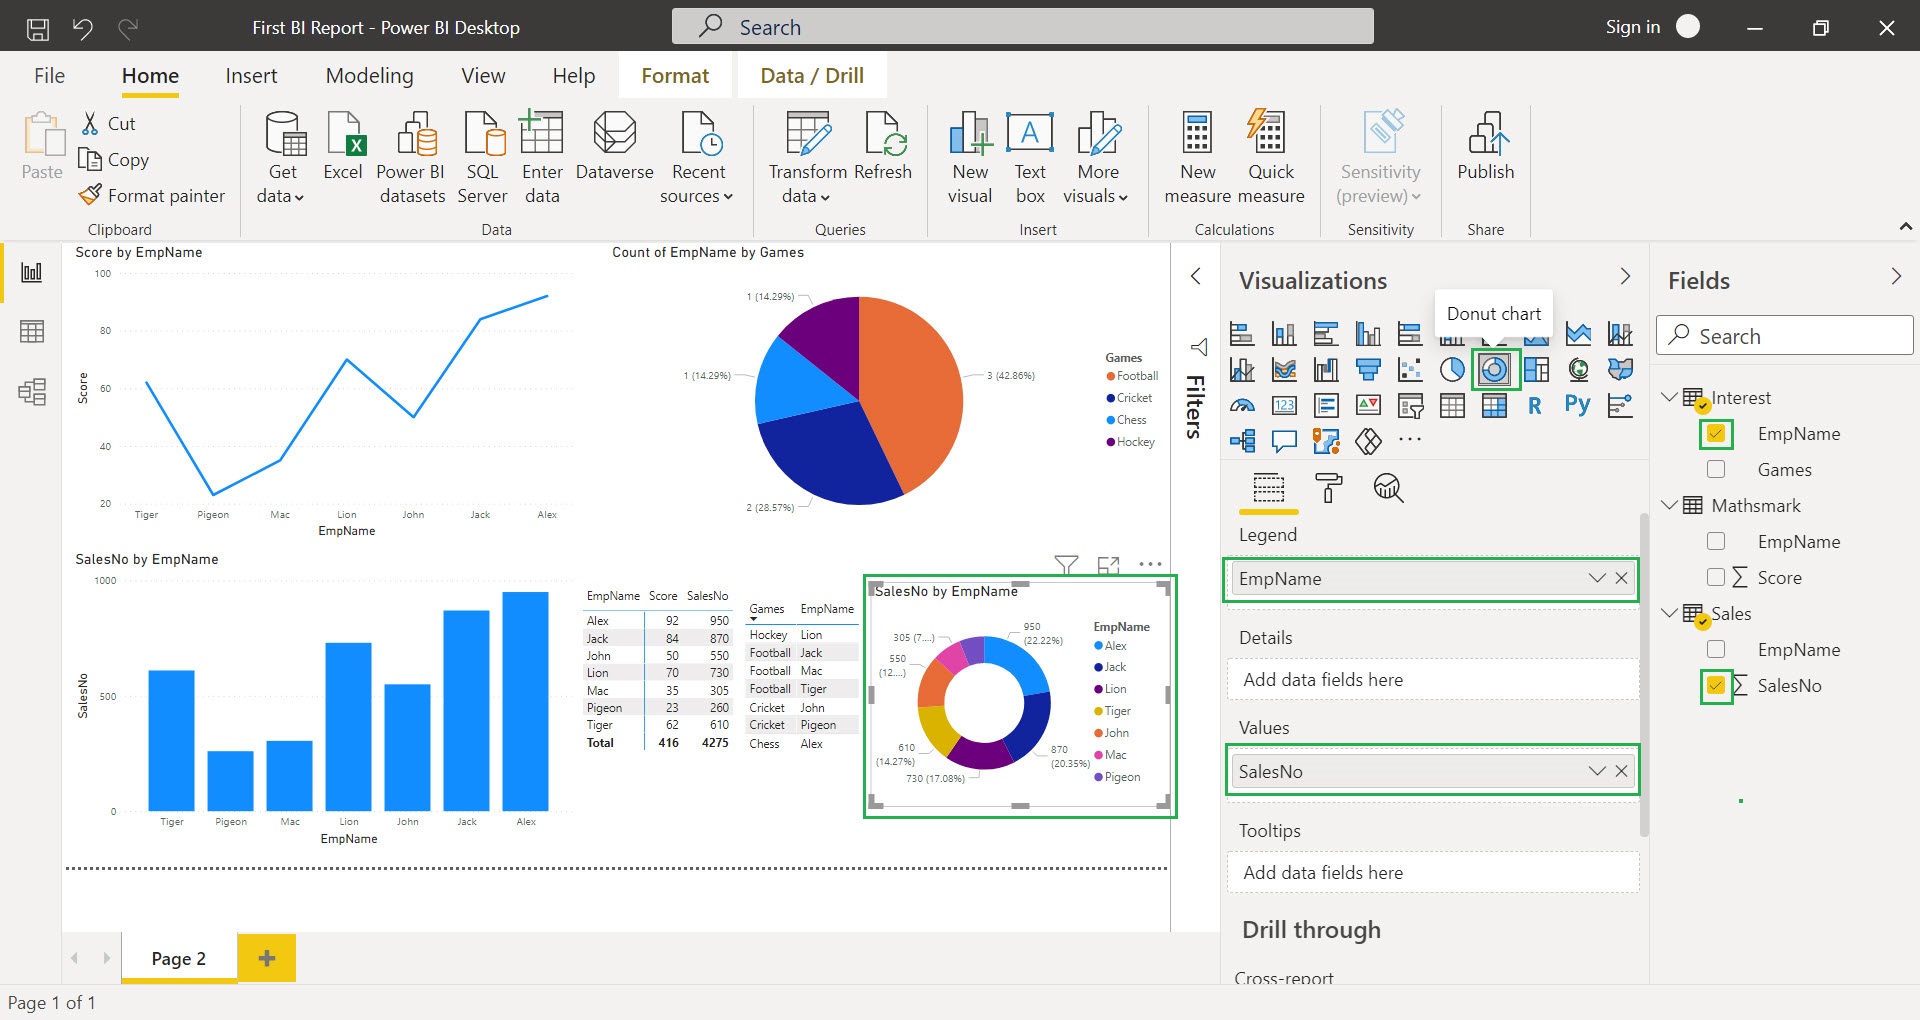
Step 7:- select “Table” in Visualizations tab and check the fields (EmpName and Games) from “Interest” table

Step 8:- select “Donut Chart” in Visualizations tab and check the “EmpName” field from “Interest” table and “SalesNo” field from “Sales” table
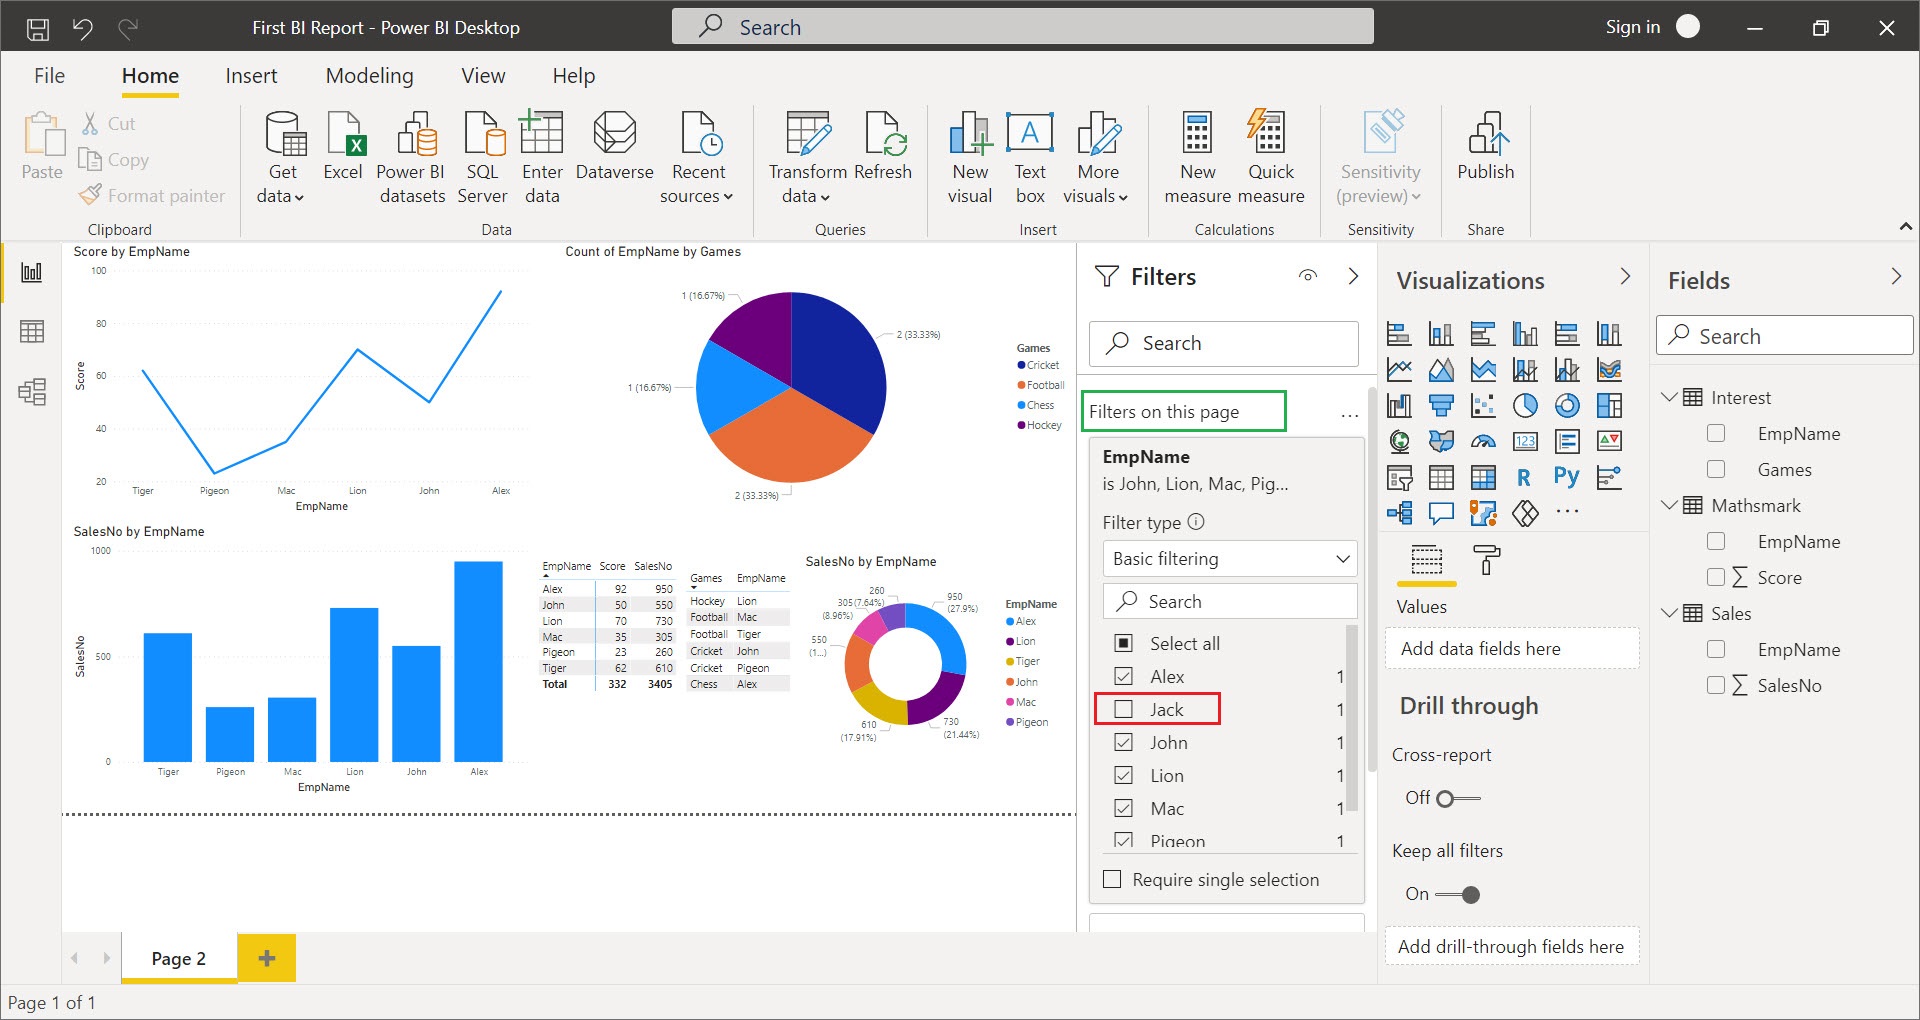
Now we will see how to filter data in dashboards/reports, in Power BI we have 3 level of filtering (Report/Visual, Page and All Page), please note that the report/visual level filter will appear only after selecting page level filter.
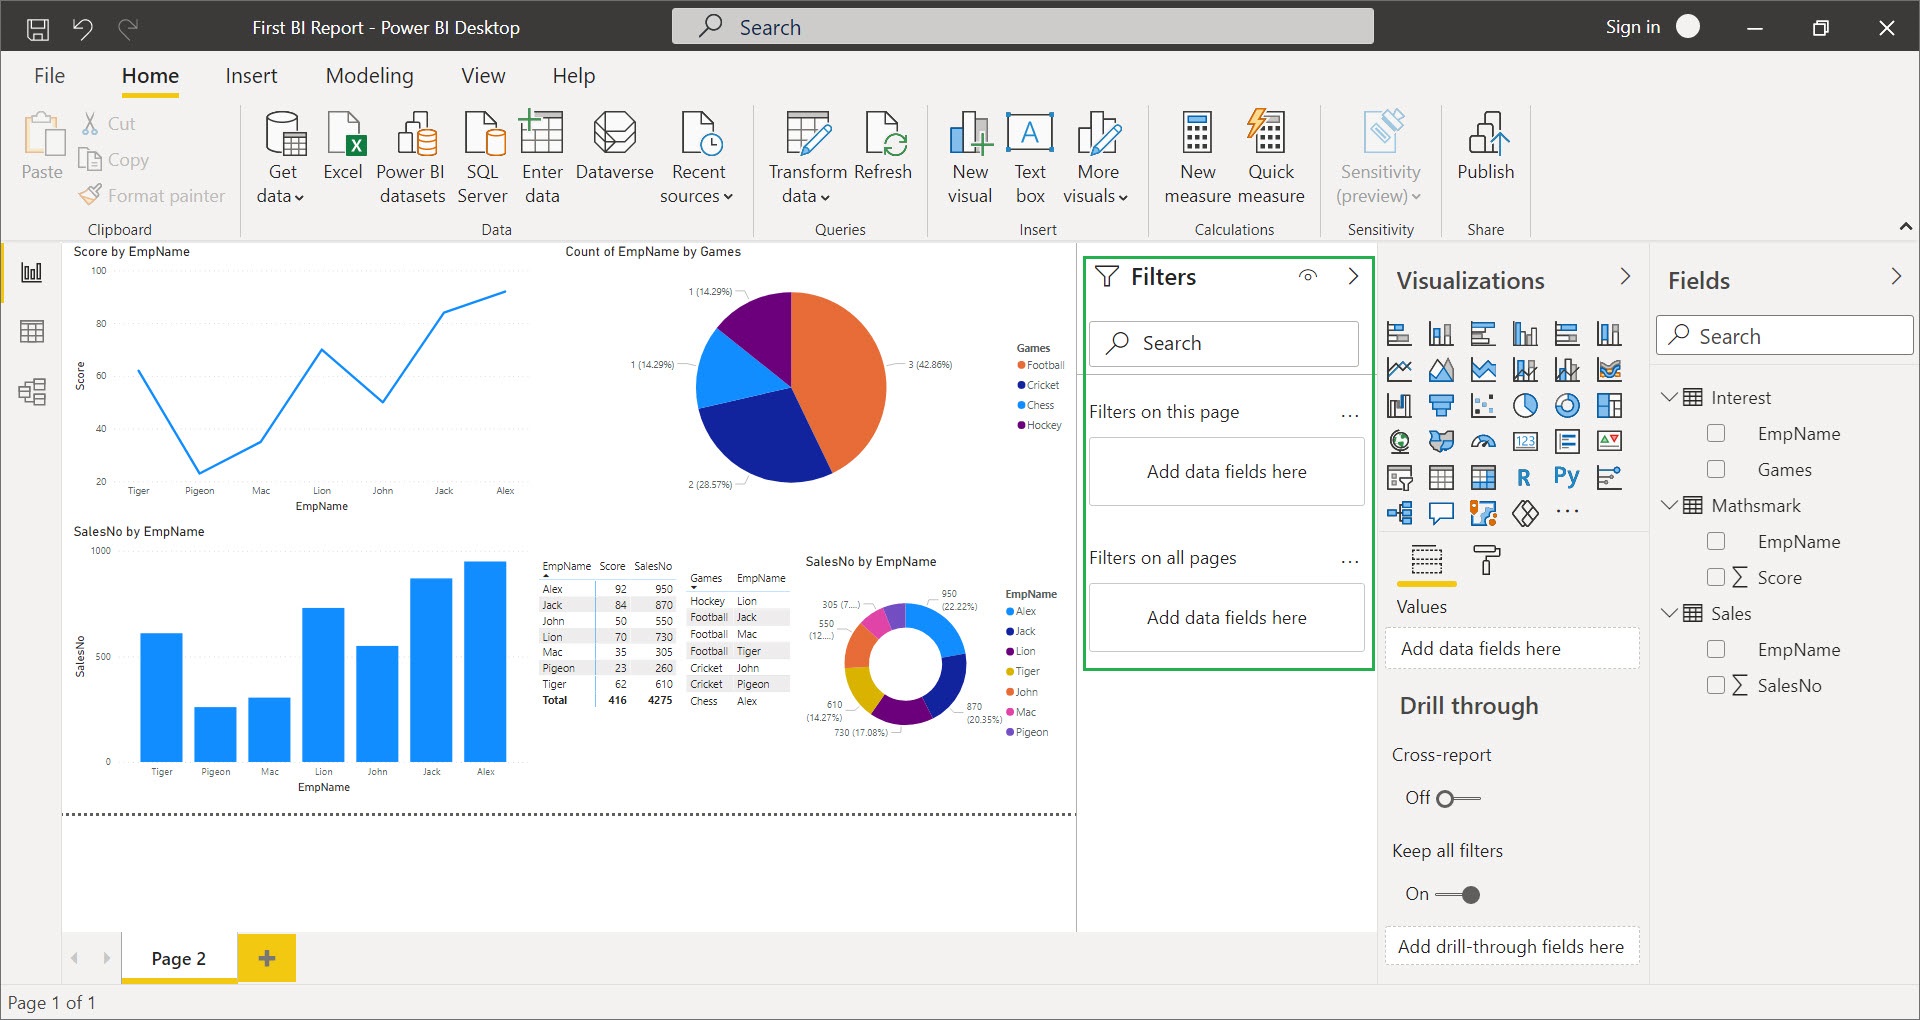
here we have used the page level filter in which (EmpName =”Jack”) is excluded, now the dashboard is showing all Employee’s data expect “Jack”
Happy Learning !! Please share it with your friends If you like this post.
