Here is a short program in Python to identify the count of duplicate lines in a text file.
import tkinter as tk
from tkinter import filedialog
from collections import defaultdict
import pandas as pd
import collections
from pathlib import Path
import os

root= tk.Tk()

canvas1 = tk.Canvas(root, width = 800, height = 300)
canvas1.pack()

label1 = tk.Label(root, text='Log Analyser')
label2 = tk.Label(root, text='Import a file...')
label1.config(font=('Arial', 20))
label2.config(font=('Arial', 10))
canvas1.create_window(400, 50, window=label1)
canvas1.create_window(200, 180, window=label2)

def getLogFile ():
      global df

      import_file = filedialog.askopenfilename()
      Counter = 0

      with open(import_file, "r+") as f:
            d = f.readlines()
            f.seek(0)
            entries = Path(import_file)
            fileabspath = os.path.abspath(import_file)

            fw= open(fileabspath.replace(entries.name,"Duplicate_Log_Info.txt"),"w+")

            counts = collections.Counter(l.strip() for l in f)
            for line, count in counts.most_common():
                #print (line, "|"+str(count))
                fw.write(line + "|"+str(count) + "\n")
            label3 = tk.Label(root, text=entries.name + ": Import is successful, Please check the output file - "+ fw.name + ".")
            label3.config(font=('Arial', 10))
            canvas1.create_window(400, 220, window=label3)
            f.close()
            fw.close()


browseButton_Excel = tk.Button(text='Choose a file...', command=getLogFile, bg='green', fg='white', font=('helvetica', 12, 'bold'))
canvas1.create_window(400, 180, window=browseButton_Excel)

button3 = tk.Button (root, text='Close', command=root.destroy, bg='green', font=('helvetica', 11, 'bold'))
canvas1.create_window(500, 180, window=button3)

root.mainloop()
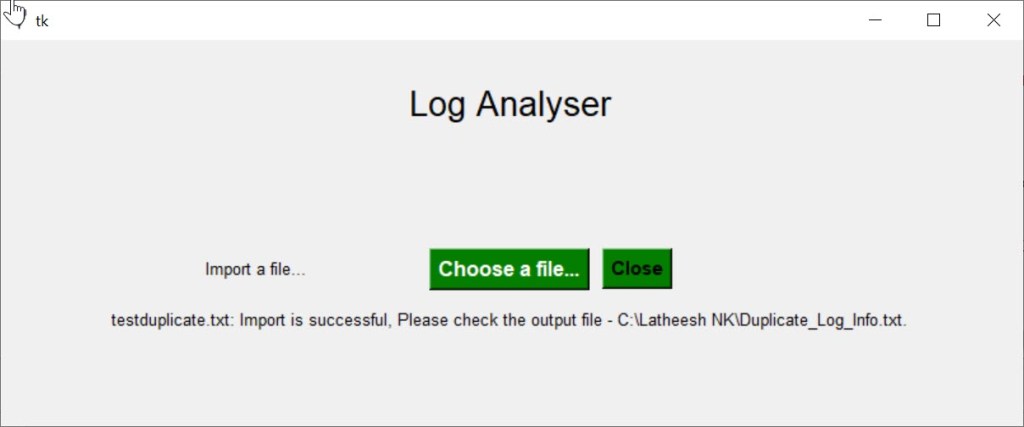
Output:

If you enjoyed this blog post, feel free to share it with your friends!