Author: Latheesh NK

Could not update the metadata that indicates database <> is enabled for Change Data Capture. The failure occurred when executing the command ‘SetCDCTracked(Value = 1)’. The error returned was 15517: ‘Cannot execute as the database principal because the principal “dbo” does not exist, this type of principal cannot be impersonated, or you do not have permission.’. Use the action and error to determine the cause of the failure and resubmit the request.

While configuring Change Data Capture on a database that is restored from different environment, we might end up with an error message as below:

Could not update the metadata that indicates database <> is enabled for Change Data Capture. The failure occurred when executing the command ‘SetCDCTracked(Value = 1)’. The error returned was 15517: ‘Cannot execute as the database principal because the principal “dbo” does not exist, this type of principal cannot be impersonated, or you do not have permission.’. Use the action and error to determine the cause of the failure and resubmit the request.

To resolve the issue, we need to change the owner of database and then enable CDC for the database as below. Please note that, the database would have restored irrespective of the error. You just have to run the below statement to avoid similar issues in future.

EXEC sp_changedbowner 'sa'
EXEC sys.sp_cdc_enable_db ;

Ref: https://docs.microsoft.com/en-us/sql/relational-databases/system-stored-procedures/sp-changedbowner-transact-sql?view=sql-server-2017

Decoding hexa error code to windows error message in SQL Server

Problem Statement:
Sometimes, the error messages generated are not friendly to understand the underlined issues. This is going to be an extra effort to google out for most of us with the error code (mostly a hexa value) and identify the corresponding windows error message.

Solution:
A simple solution would be to use NET HELPMSG with the errocode. But if the error code is a hexa value, then we need to identify the corresponding Decimal value to use as a parameter to NET HELPMSG.

Here is a script to identify actual error message from hex error code. This is important to be aware that this approach will only work for Win32 error codes from Microsoft Windows. If the net helpmsg command does not return a result, the cause is likely the error has not originated from Windows, or no longer a valid Win32 process.

DECLARE @hex VARCHAR(64) = '0x80070643'
Set @hex = Right(@hex,4)

DECLARE @rez BIGINT;
SELECT @rez = ISNULL(@rez,0) * 16 + 
CHARINDEX(substring(@hex,n.number+1,1),'0123456789ABCDEF') - 1
FROM MASTER..spt_values n WHERE n.TYPE='P' AND n.number<len(@hex)

/*
	--To use NET HELPMSG, need to enable xp_cmdshell as below:

	EXEC sp_configure 'show advanced options',1
	RECONFIGURE WITH OVERRIDE
	EXEC sp_configure 'xp_cmdshell',1
	RECONFIGURE WITH OVERRIDE
	EXEC sp_configure 'show advanced options',0
	RECONFIGURE WITH OVERRIDE
*/

Declare @Table Table(WindowsErrorMessage nVarchar(MAX))
Declare @s nvarchar(500) = 'NET HELPMSG ' + Cast(@rez as varchar(MAX))
Insert into @Table 
exec xp_cmdshell @s

Select @hex HexaVal,@rez DecimalVal,* From @Table 
where WindowsErrorMessage is not null

How to Replay a SQL Server Profiler trace in SQL Server

It is one of the most interesting topic in SQL Server “How to Replay profiler”. But, I have not seen this feature is used efficiently by many. Today, we are going to see how can we use Replay profiler in SQL Server.

Usages:

1. Can be used to reproduce issues in one environment to another environment(production environment to lower environments)
2. Can be used to run the trace multiple times as part of investigation

Now, Let us quickly see how can we use the Replay option in SQL Server.

1. Collect the Profiler trace with Replay option.

This is a very important step to collect what needs to replay. SQL Profiler provides a default template to choose the Replay option. We need to select the template and run the profiler on the source server/database while we execute the functionality that needs to be applied to target database/server.

2. Save the collected trace to a Table

3. Once saved the Replay trace, you can connect to target server and open the trace collected

File -> Open -> Trace Table -> Connect the server that trace saved

4. Once the trace is opened in the Profiler window, we can run the Replay Trace

Replay -> Start -> Select “Target Server”
You can select Replay Configuration in the window as below:(Not covering all the option here, please explore and configure as required)

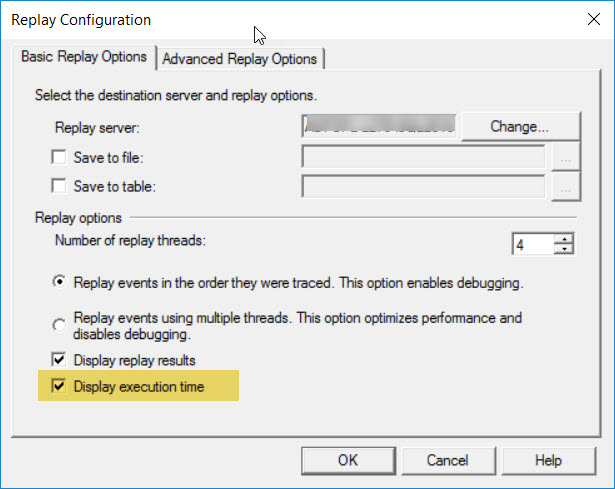
I (my personal choice) usually include “Display Execution Time”, but its optional.

Once the configurations are set, we can “Start” the Replay.

If you see the above sample snapshot, we can see that the trace has been run successfully. However, we see errors in the screenshot as when I tried to run the trace in the same server and database.

How do we run this trace in different server and different database?

Its always a case that we cannot expect the database name will be same in all environment. For an example, developer would have kept multiple version of same database like database_dev, database_unittest etc to test various purposes. If we try to run the trace as it is, we will end up with errors. To run on different environment, you need to make few changes as below:

1. Go to Management Studio (SSMS) and select the database where the trace table collected
2. Update the database Name and database id columns of the table to your target database name and database id


That means, the trace data needs to be changed for its database id and database name as per the target environment.Once the trace table data has been modified, we can follow the same procedure mentioned above(3 and 4).

How to identify parallel plans in SQL Server

Few years back, on one of my engagements, identified lots of performance issues with an application. As part of a detailed analysis, it is observed there are lots of queries under performing with wait type “CXPACKET”. In short, CXPACKET wait types are involved in parallel query execution. These wait types indicate that the SPID is waiting on a parallel process to complete or start. There are many reasons your query may undergo a parallel execution like missing index, non optimized sql script etc. But, CXPACKET is not ALWAYS a bad thing.We will see about CXPACKET in detail with another post.

Now, We will see how to identify the queries with parallel execution. Once you identified the queries, you can further examine to identify the actual cause of the issues and optimize.

Script

select p.*,q.*,cp.plan_handle
from sys.dm_exec_cached_plans cp
cross apply sys.dm_exec_query_plan(cp.plan_handle) p
cross apply sys.dm_exec_sql_text(cp.plan_handle) as q
where
cp.cacheobjtype = 'Compiled Plan' and
p.query_plan.value('declare namespace
p="http://schemas.microsoft.com/sqlserver/2004/07/showplan";
max(//p:RelOp/@Parallel)', 'float') > 0

Please note that the above query gets information from cached plan in SQL Server. Hence, I will recommend to run a load test with a real time workload and use the script to identify the parallel executing queries. It is also important that the cached plans may get flushed due various factors like memory pressure, recompile of procedures, auto stats updates etc. But, this helped me a lot at times!!!

[Edit – 8th-Sep-202]

How do we know the degree of parallelism of a currently running query?

select session_id, scheduler_id
from sys.dm_os_tasks
where parent_task_address IS NOT NULL
--AND session_id = ? --You can uncomment and give spid as required.

I’d like to grow my readership. If you enjoyed this blog post, please share it with your friends!